Data visualization stream “Beauty of Data with SAP Lumira” by Skybuffer. Enjoy our USA vs Russia vs Germany countries comparison!
Military Capability
Note: Fire power chart is updated based on the public opinion.
Note: Fire power chart is updated based on the public opinion.
Economic Strength
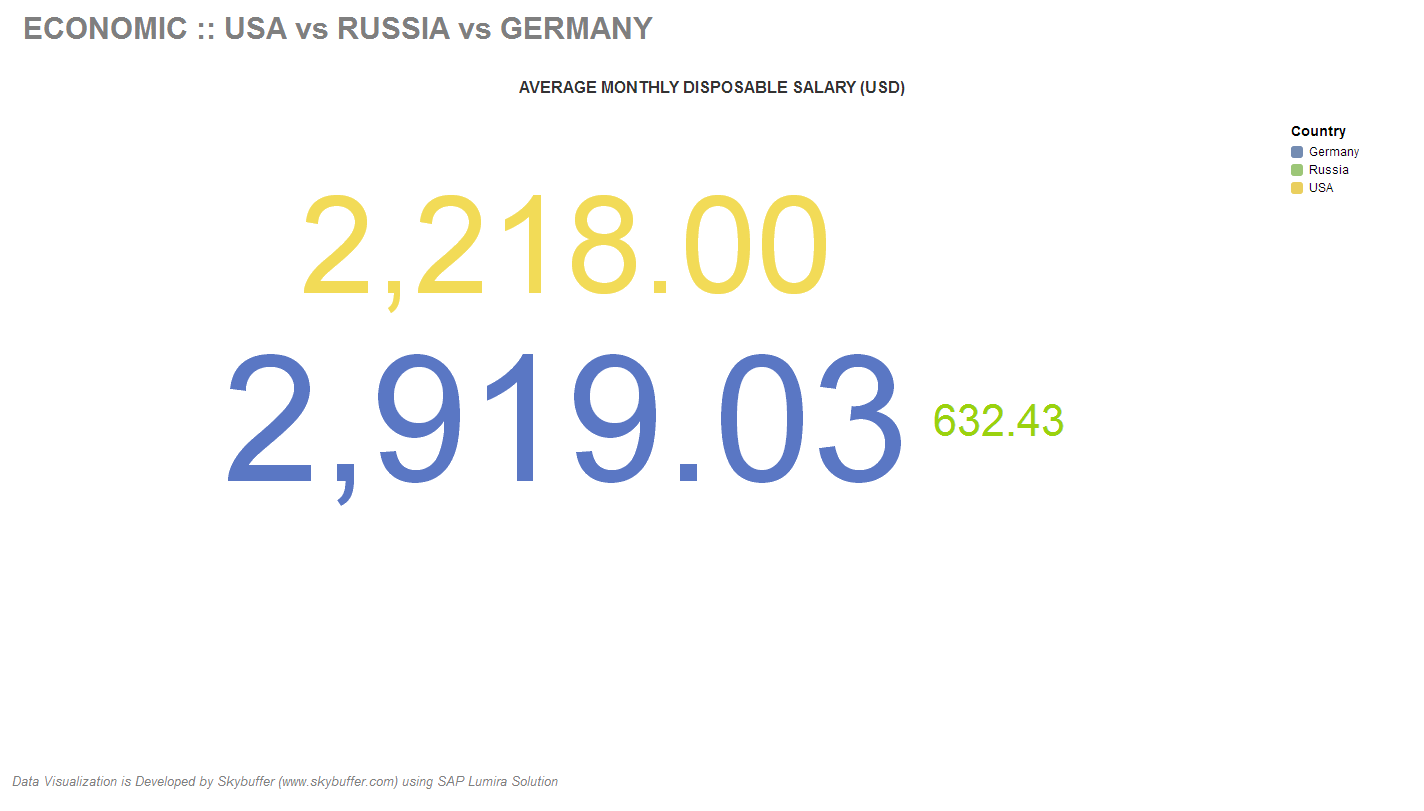
Note: Chart type is changed according to the public opinion.
Note: Chart type is changed according to the public opinion.
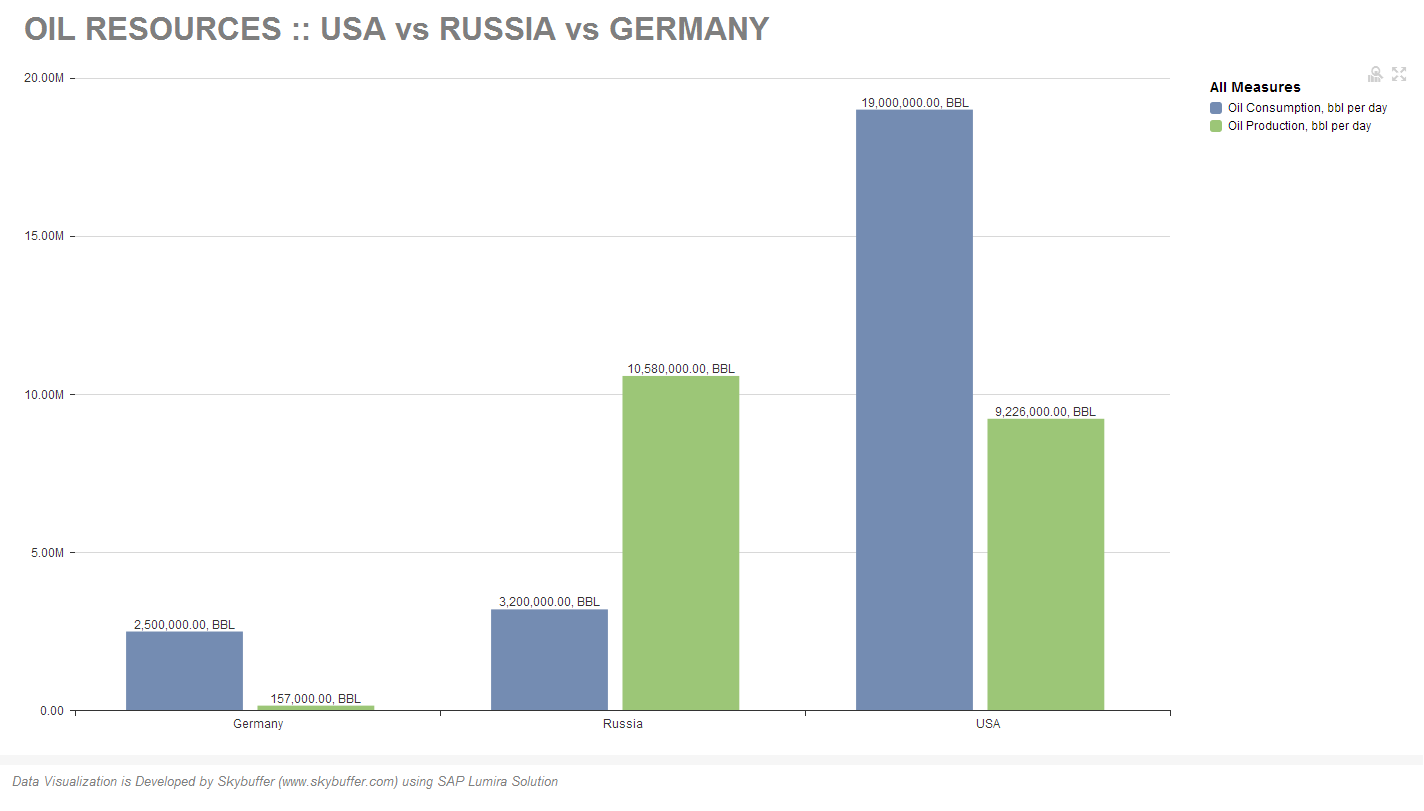
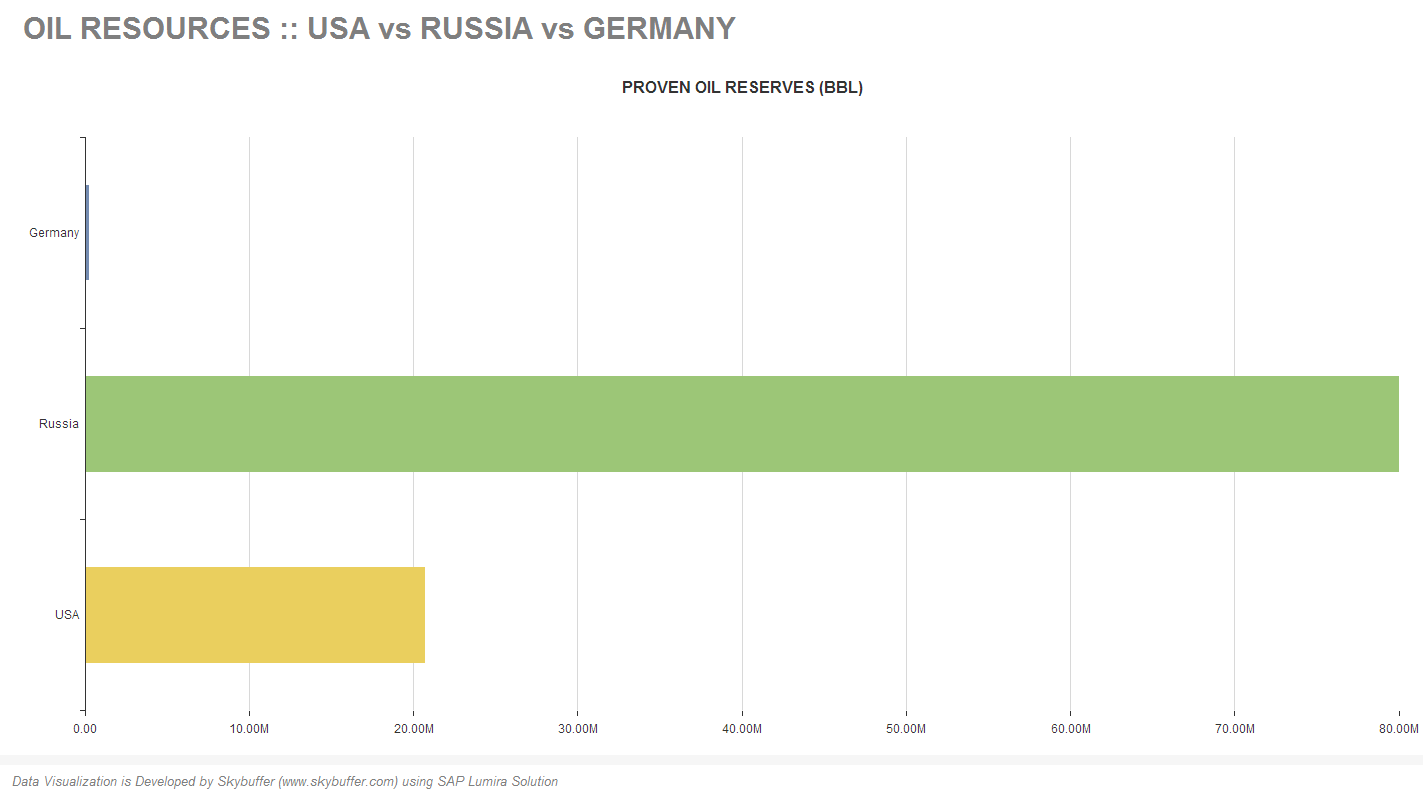
Oil Resources
Note: Chart data is adjusted according to the data source www.eia.gov.
Visualization Summary
There were no goal to find out the leader of those three countries. More over, it is hard to disagree that either USA, or Russia or Germany has strong influence both regionally and globally.
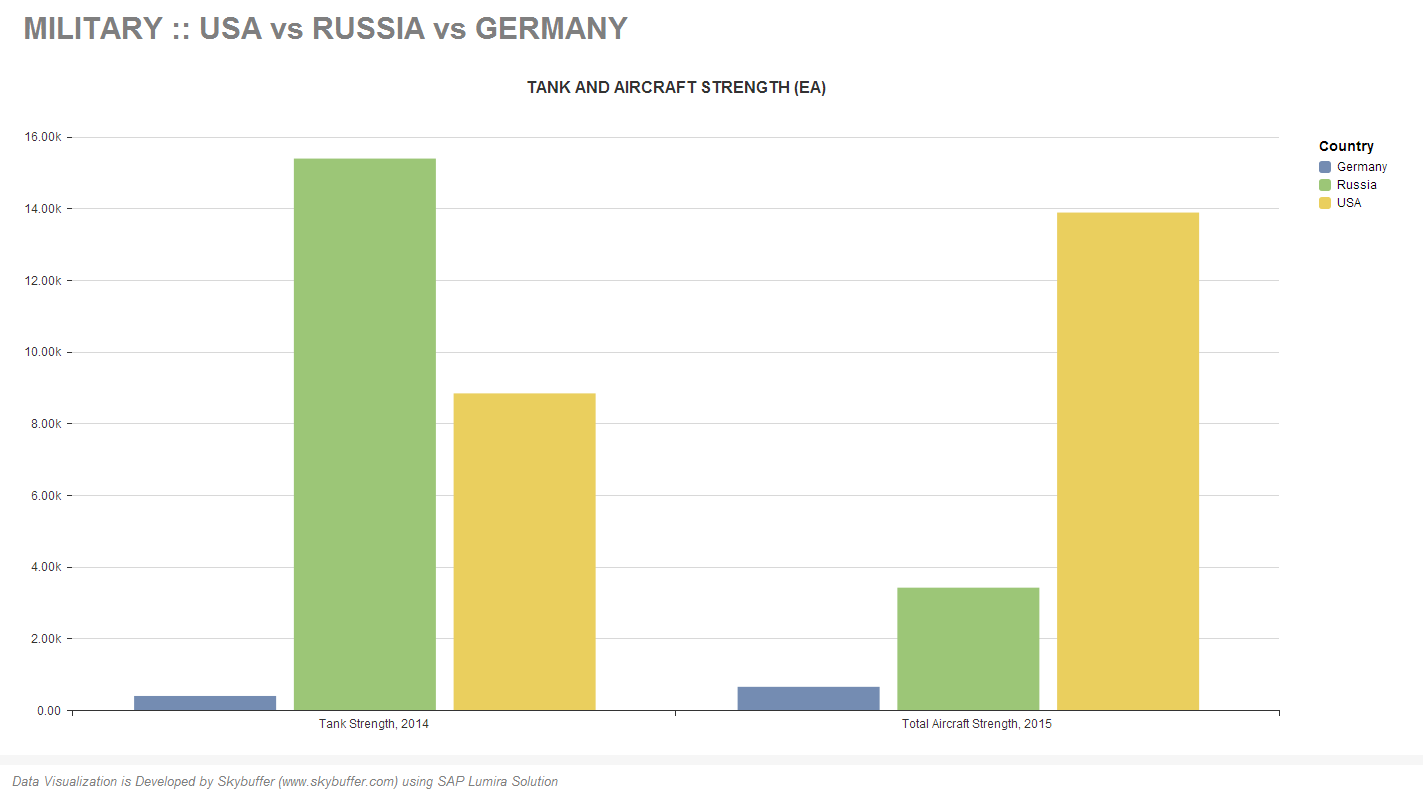
There are lots of conclusions could be taken from those graphs, like, for instance, Fig. 02 shows differences in defense strategies. USA is more focused on distance missions and that is why it has more powerful aircraft strength. While Russia has much more tanks and it is focused on the grounds missions more the on the distance intervention. As for the Germany, it is balancing and focused on the defense of country borders.
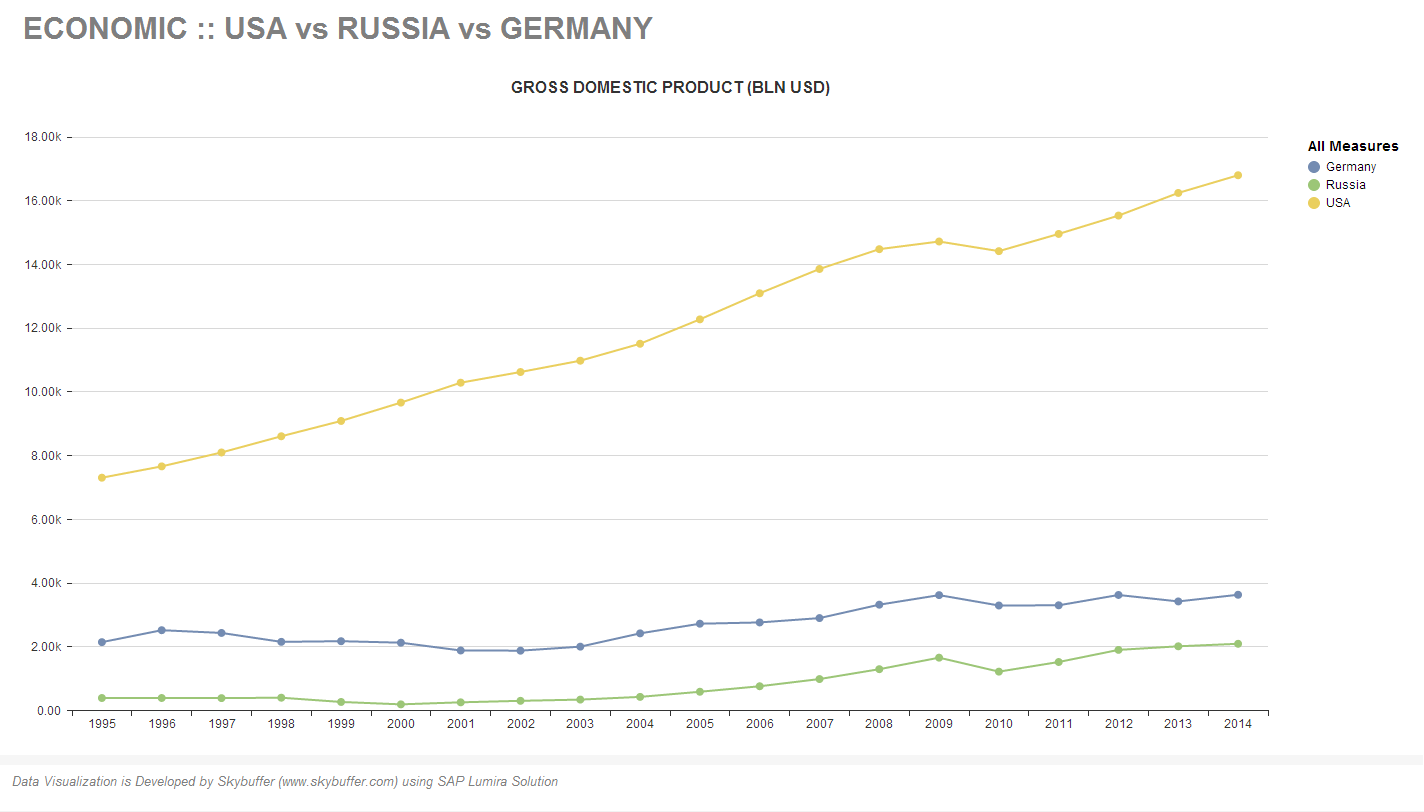
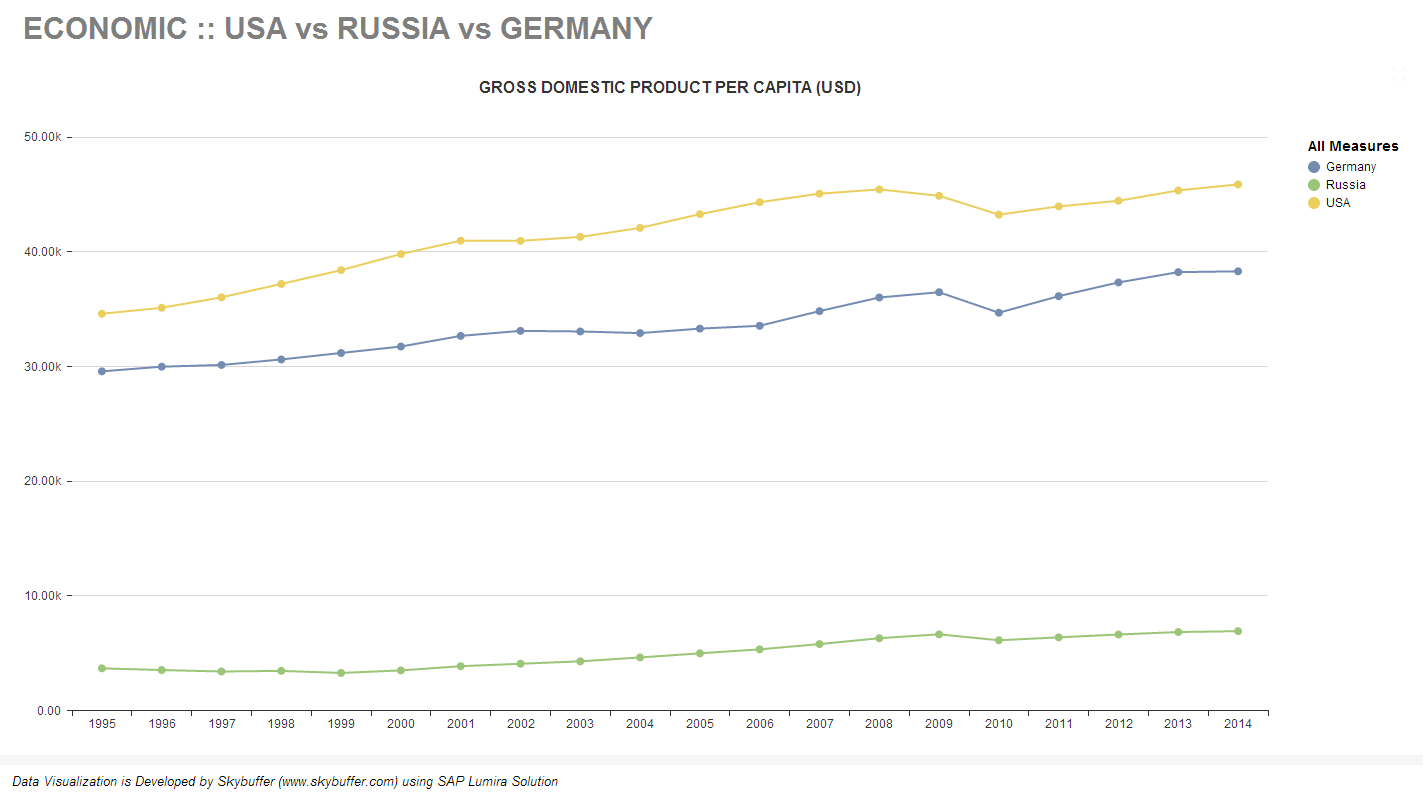
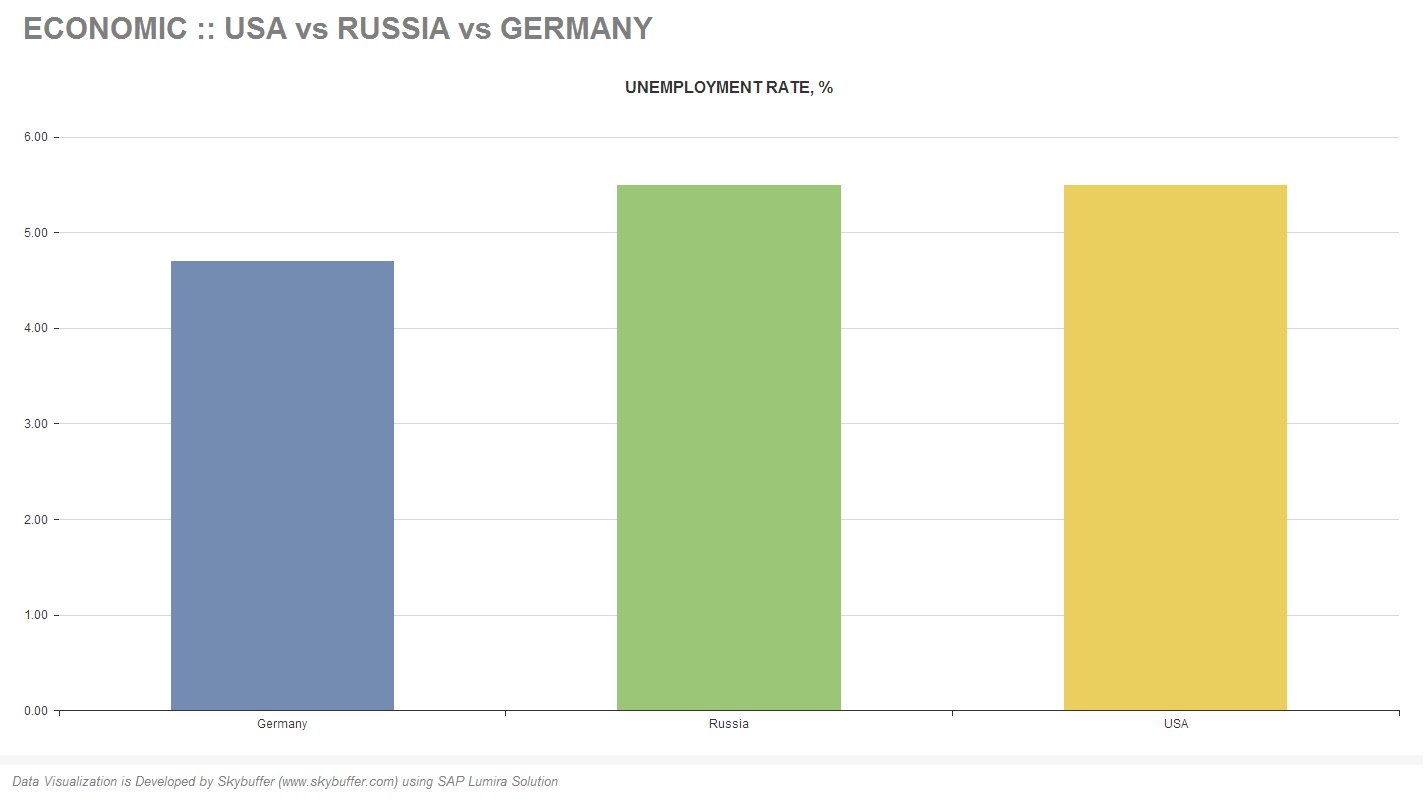
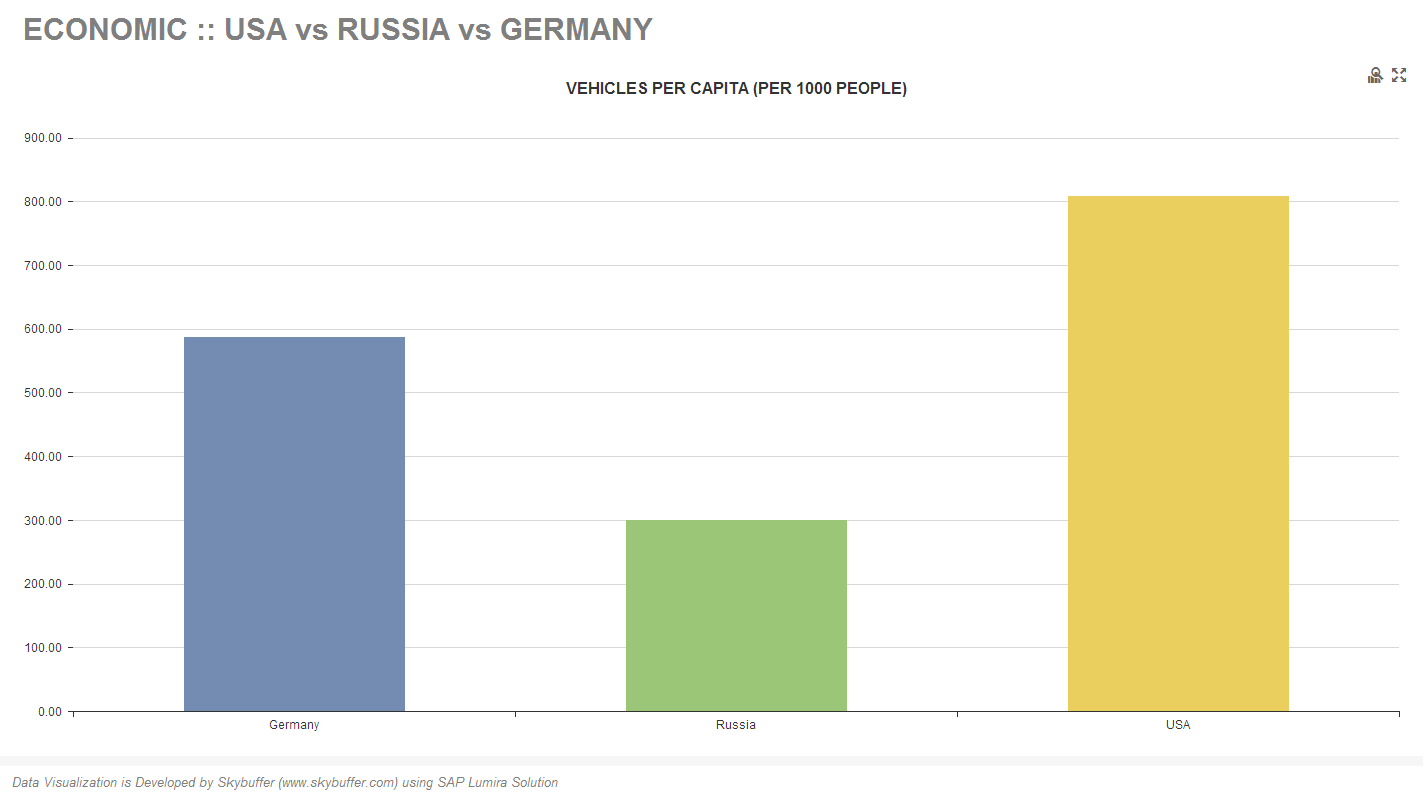
Economically Russia is the weakest player from those three, but it might be good to see this information via the prism of costs of living, that are much lower in Russia then in USA or Germany.
Skybuffer’s Visualization Activity Mission
Skybuffer Center of Expertise at Business Intelligence decided to start data visualization stream named “Beauty of Data with SAP Lumira”.
Why SAP Lumura?
That is the easiest tool that might be used for visualization of any amount of data from different kind of data sources.
It’s almost one click activity to share data visualization results via SAP Lumira Cloud.
We love to work with SAP Lumira at Skybuffer!
