It is utterly important for each company to be able to meet continuous consumers’ demand and to keep its stock at a maximum rather than minimum or just safe enough level. The costs on goods transportation can be reduced by waybills optimization, considering the capabilities of the delivering transport and minimizing the mileage.
Business Case
There are several gas stations which are provided with fuel by one Oil terminal. Request for fuel from a gas station comes when the fuel level is less than average two days consumption.
In a simple prototyping model there are two trucks assumed to be used to take fuel to gas stations.
Each truck has several tanks with different fuel types and a particular volume.
The software is to help to calculate the optimal routes for the trucks to gas stations with minimum mileage, minimum number of waybills and comply with working hours of one shift.
Continuous Product Replenishment Application
SAP Fiori (SAPUI5 hosted at SAP HANA Platform) application could be executed from Skybuffer application port:
Skybuffer :: Continuous Product Replenishment
Continuous Product Replenishment User Guide
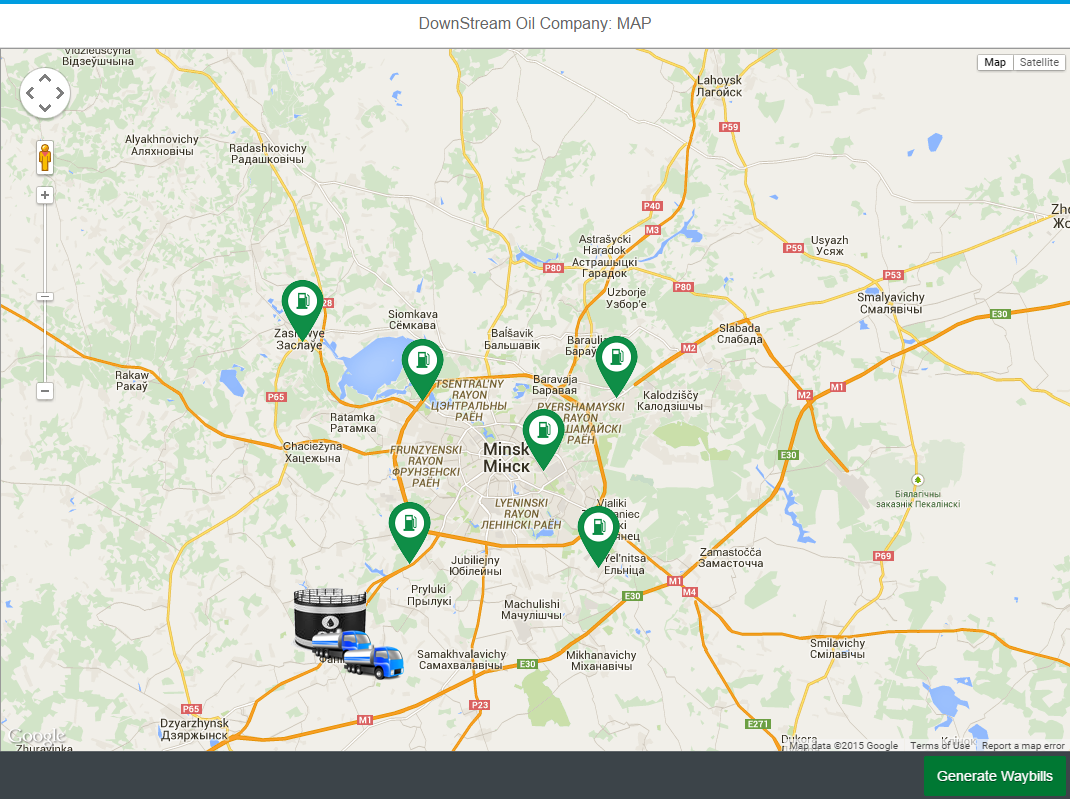
A map-based web application can be executed on the technician’s mobile device (for instance, tablet) and it displays actual information for the current fuel requirements for range of gas stations.
The Main Screen
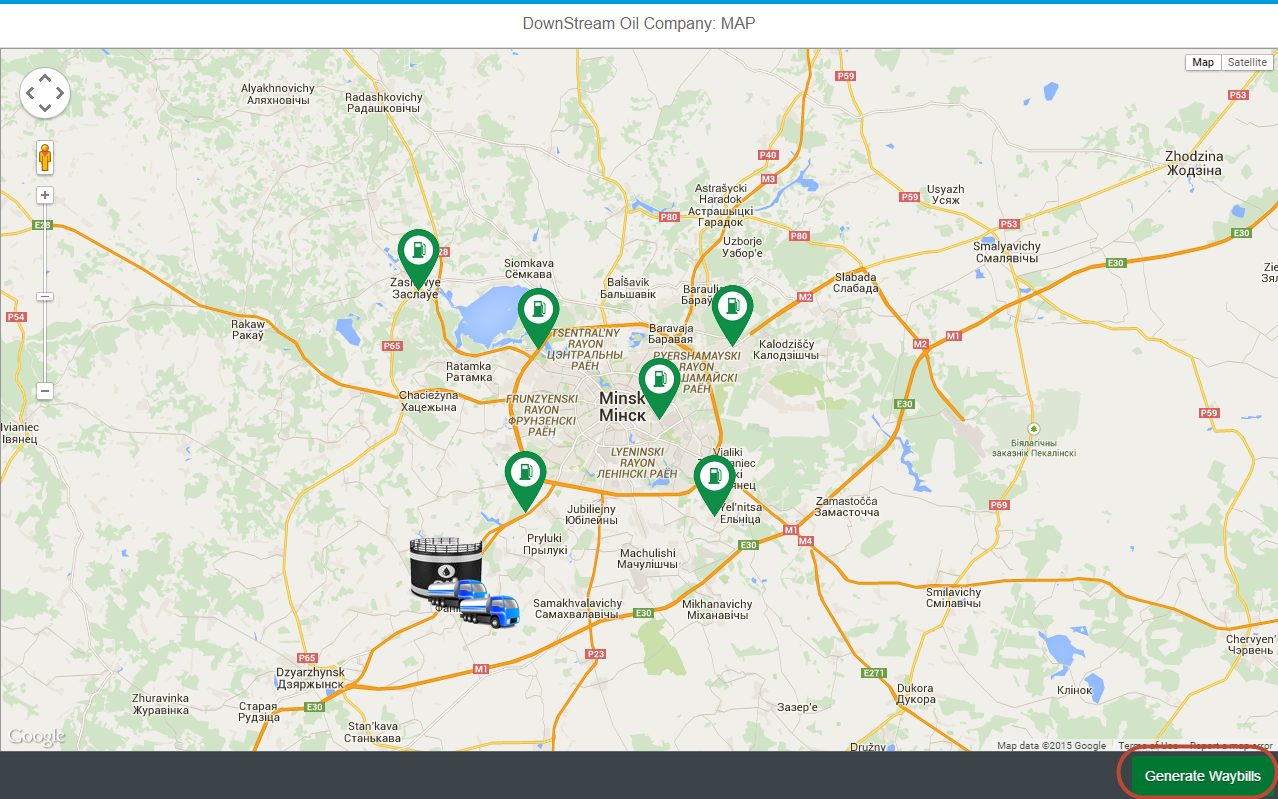
On the main screen it is possible to see the current location of the Oil terminal, gas stations and tank trucks that deliver the fuel.
Objects Info Overview
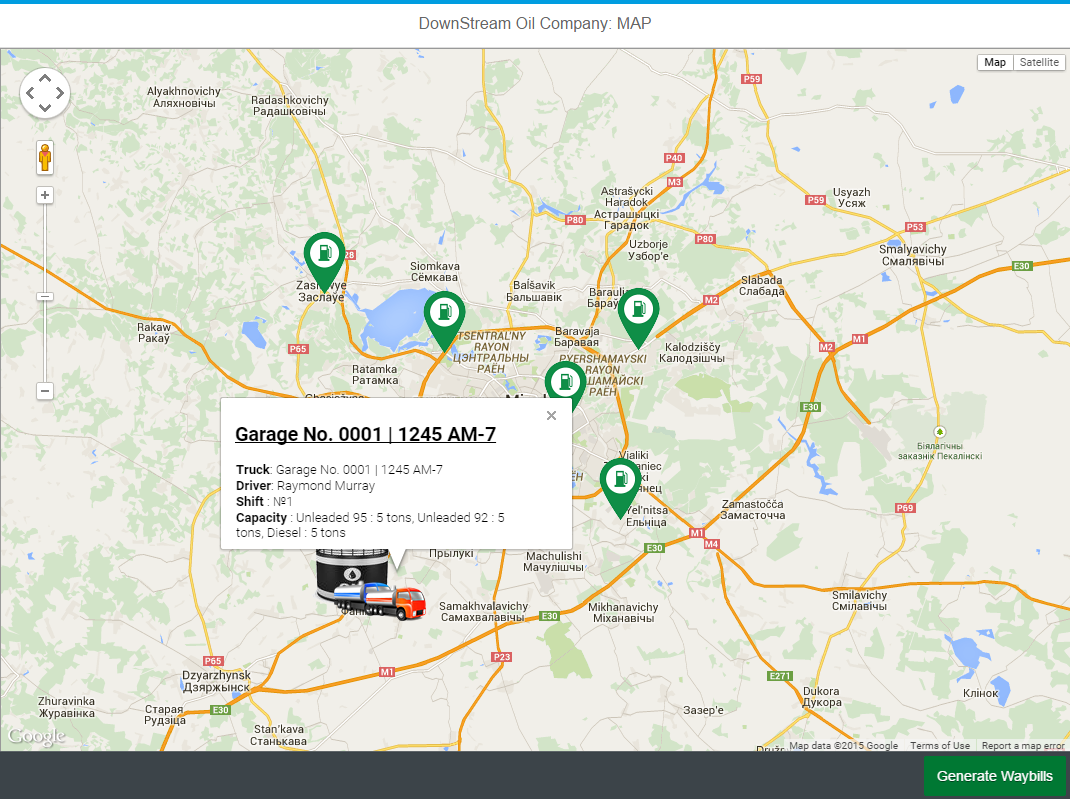
The information about the object can be shown by a simple click on it. Thus, the truck information can be displayed by a click on the truck image. There is the most useful data retrieved from SAP ERP System and shown in the truck card.
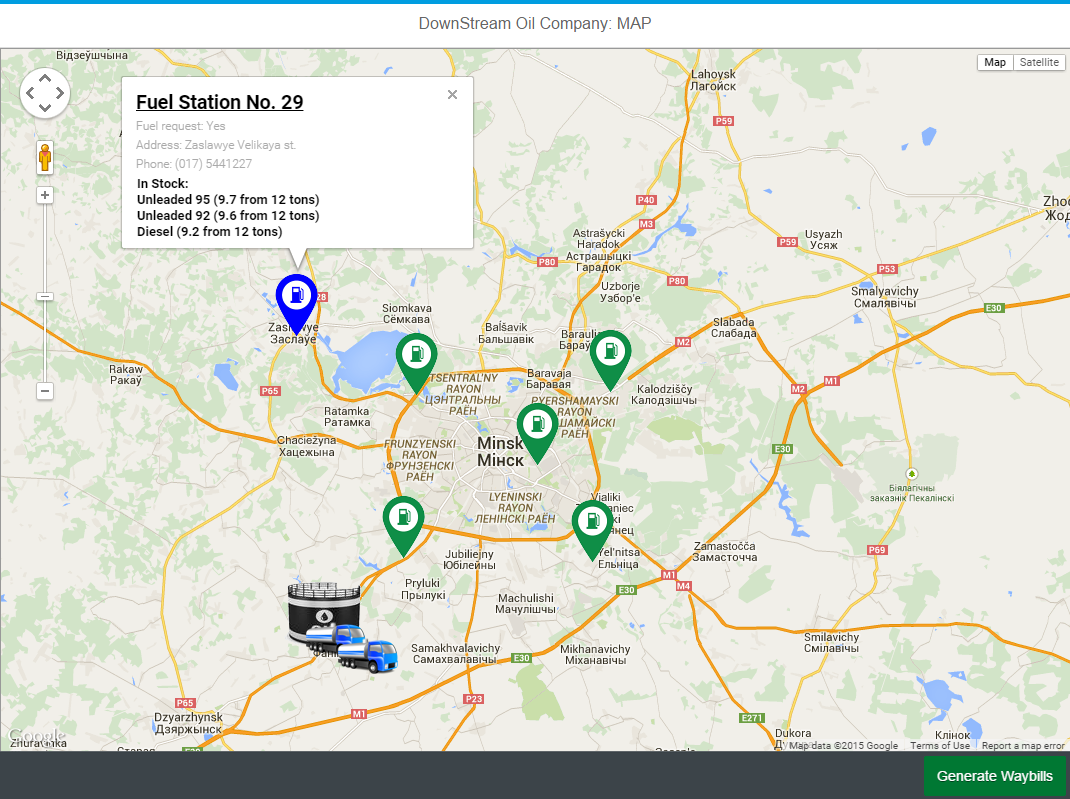
The gas station information can also be displayed with a click on the image.
The additional “fuel request” field here reflects whether the gas station tanks need re-filling.
SAP ERP Master Data Overview
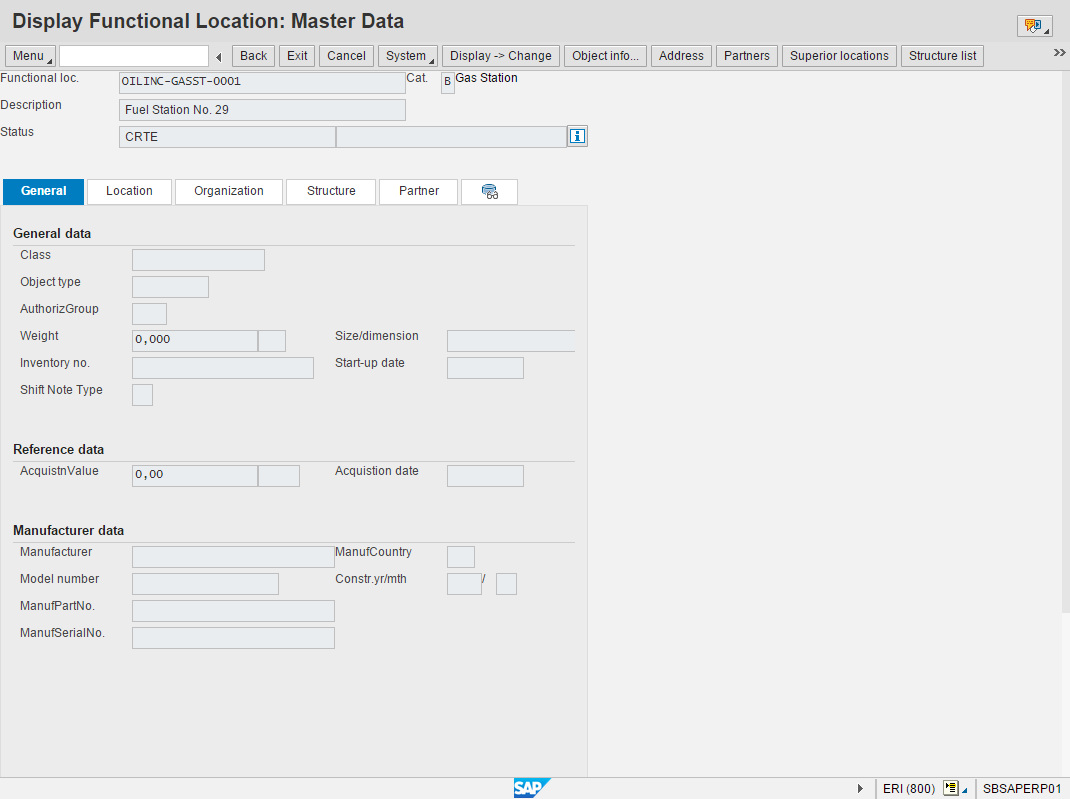
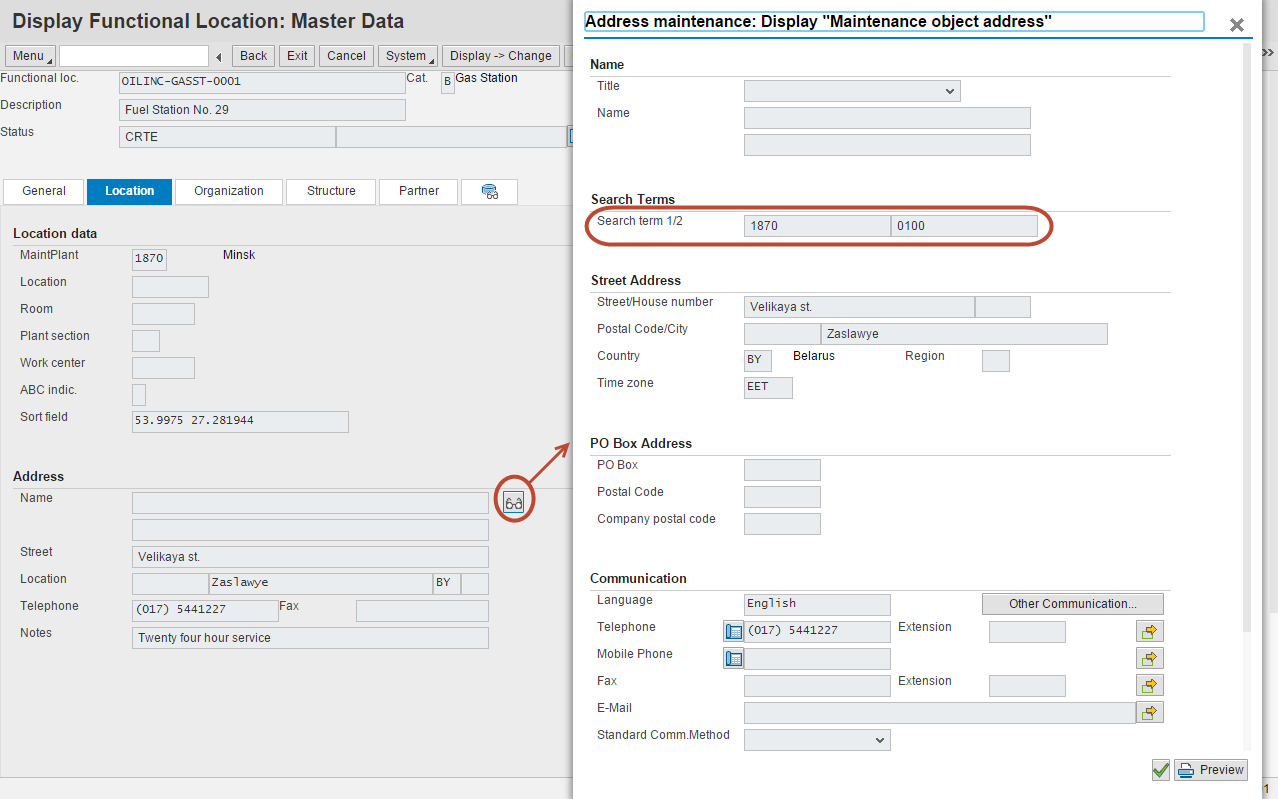
In order to explore detailed information about the objects on the map there is a link allowing to drill down to SAP ERP source document (hosted on-premise). When it is clicked, an SAP WebGUI screen is shown:
The master data category is distinguished and displayed in the web application according to SAP object’s category reflected at the Cat. field.
Reference to the Plant and Store location in the prototyping solution is represented by the Search terms field on the Display Sub-tab of Address Tab. It is done in such a way in order to reduce development costs. In the productive system it will be convenient to custom fields on the functional location level.
The exact location of the object is displayed by GPS coordinates in the Sort field.
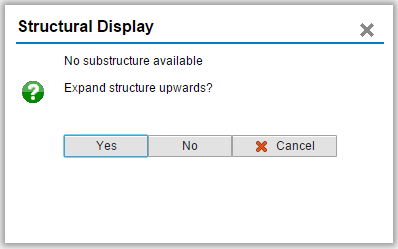
An object’s structure can be explored by the reference to the Structure list Tab. When opening the reference page, the enquiry message appears.
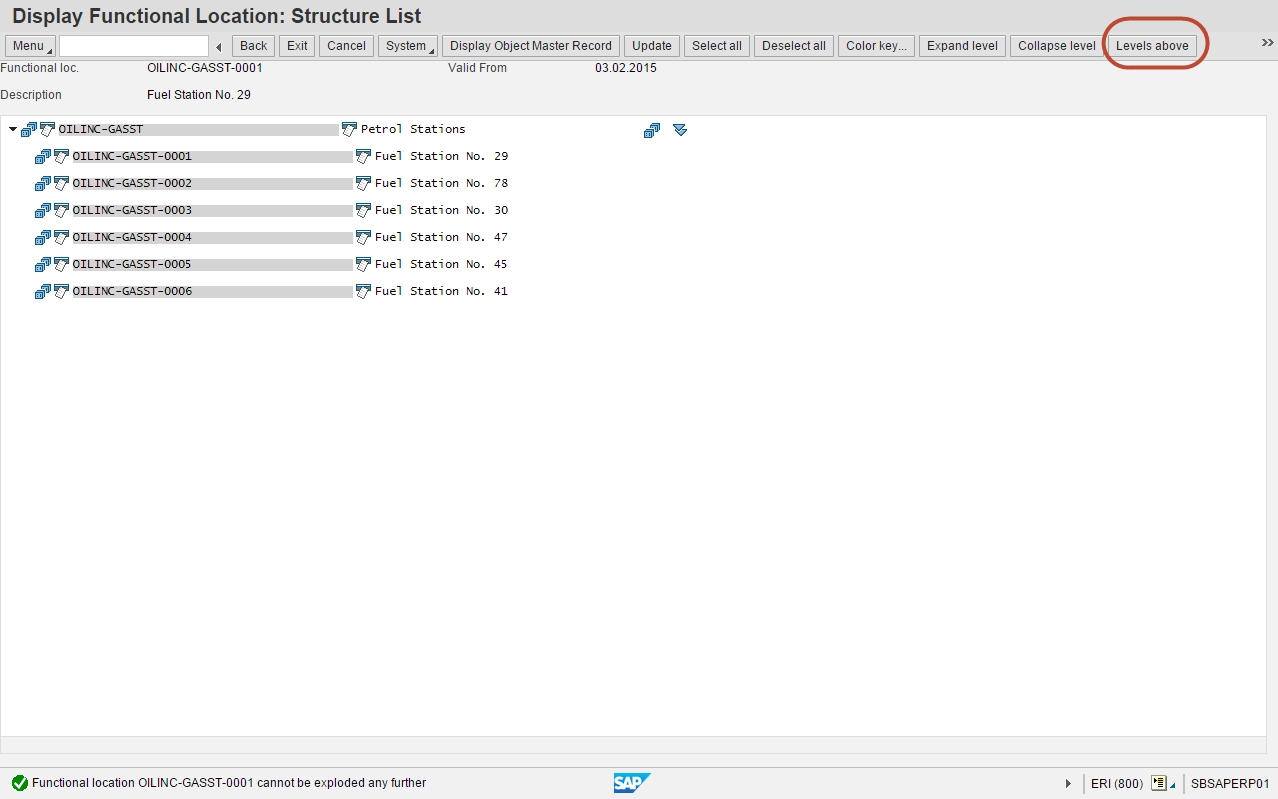
It informs that the current object does not have further hierarchical levels. Let us choose Yes button and observe the objects appearing on the same level as the current gas station.
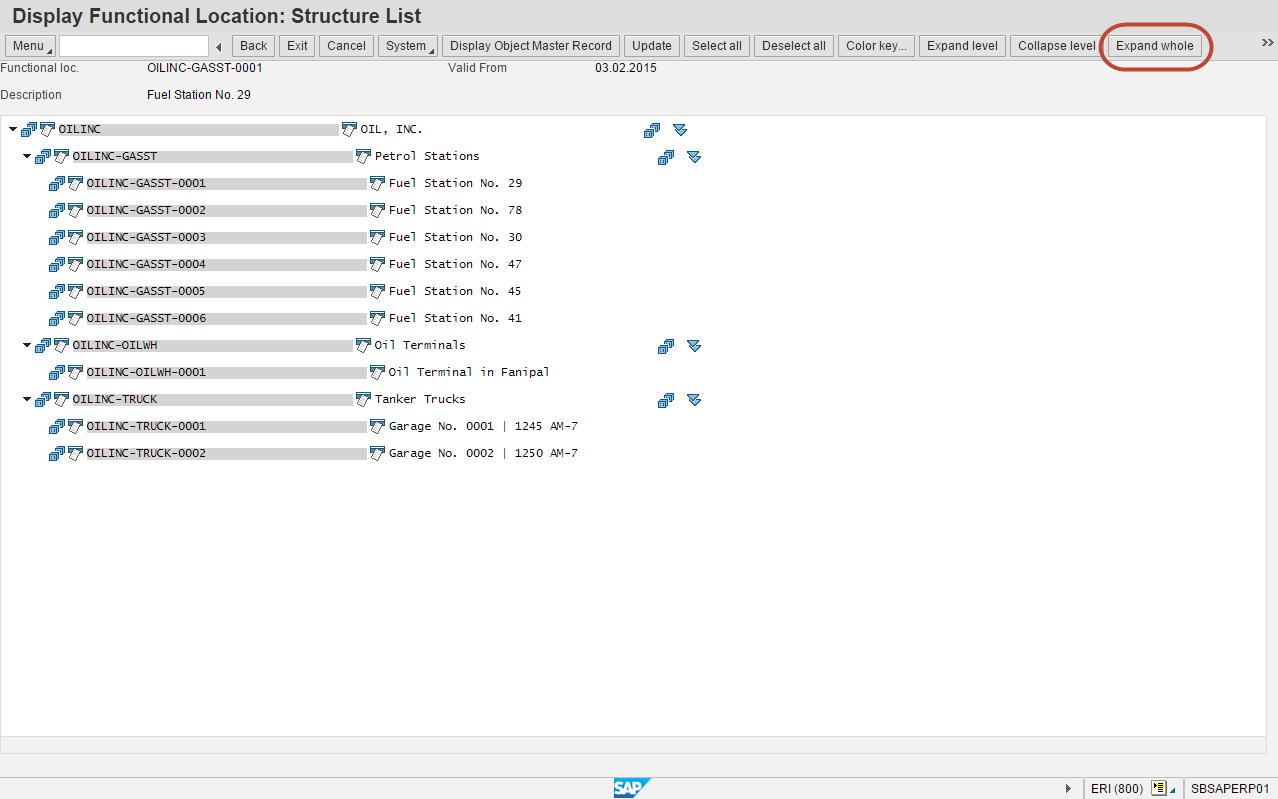
In order to observe the whole hierarchy of objects you can use the Levels above function and get in this way to the highest level of the structure. Expand whole button helps to observe all the objects in the hierarchy and to move to every object from the current window with the help of double-clicking the drill-down function.
Waybills Generation
At the beginning of the work shift waybills are to be generated. In order to do this work, a planner should push the Generate Waybills button.
The system triggers the real time transaction that finds the optimal ways for all the tank trucks taking into account trucks capacities, gas station demands and working hours of the shift.
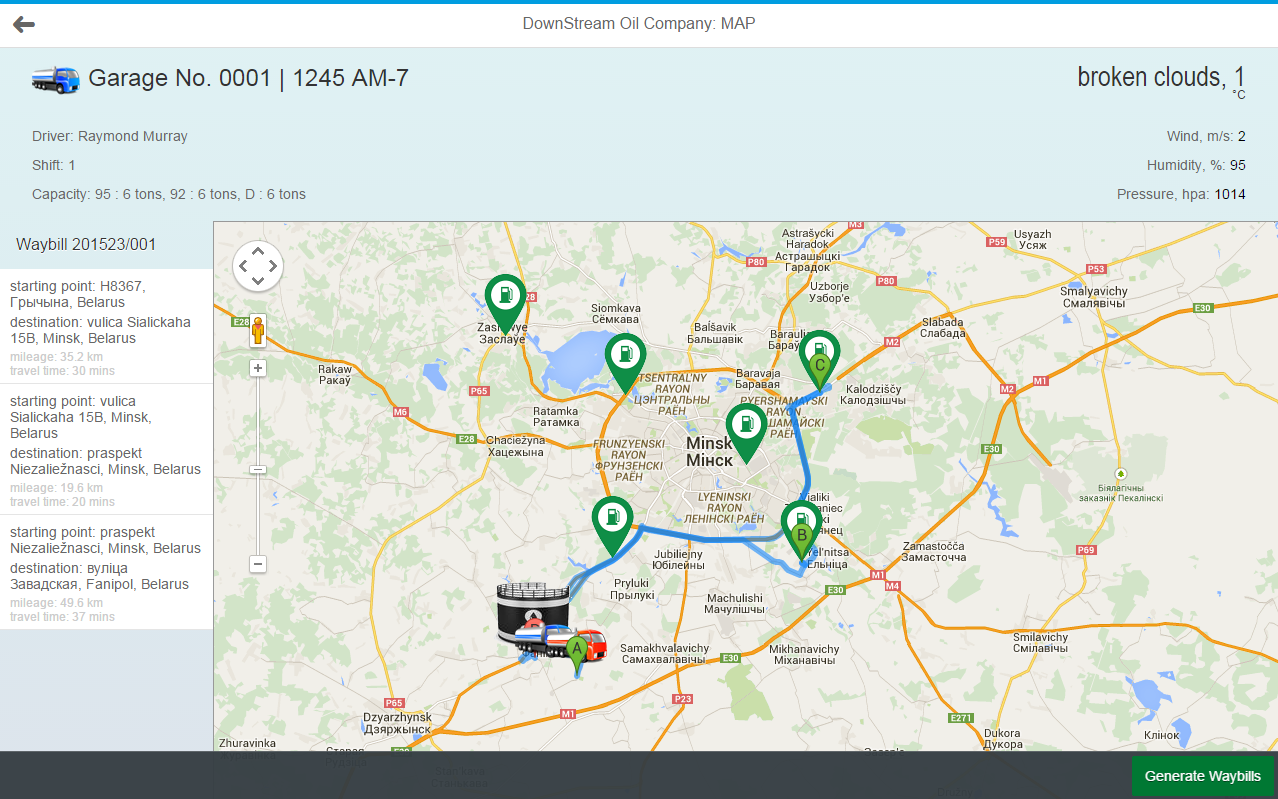
The rout for each tank truck can be shown now by clicking on the Truck’s image.
Waybills are generated in SAP ERP System and in the web application the system displays all the information necessary for the driver who is going to start his shift.
Results
SAP Fiori application for Continuous Product Replenishment helps to:
- Calculate an optimal tank truck route that saves working hours and fuel. That is extremely important for the industries with high logistics costs
- Distribute the tasks according to the current capacities of the tank trucks fleet
- Get an overview of work to be done
- Get updated information on products requirements

