

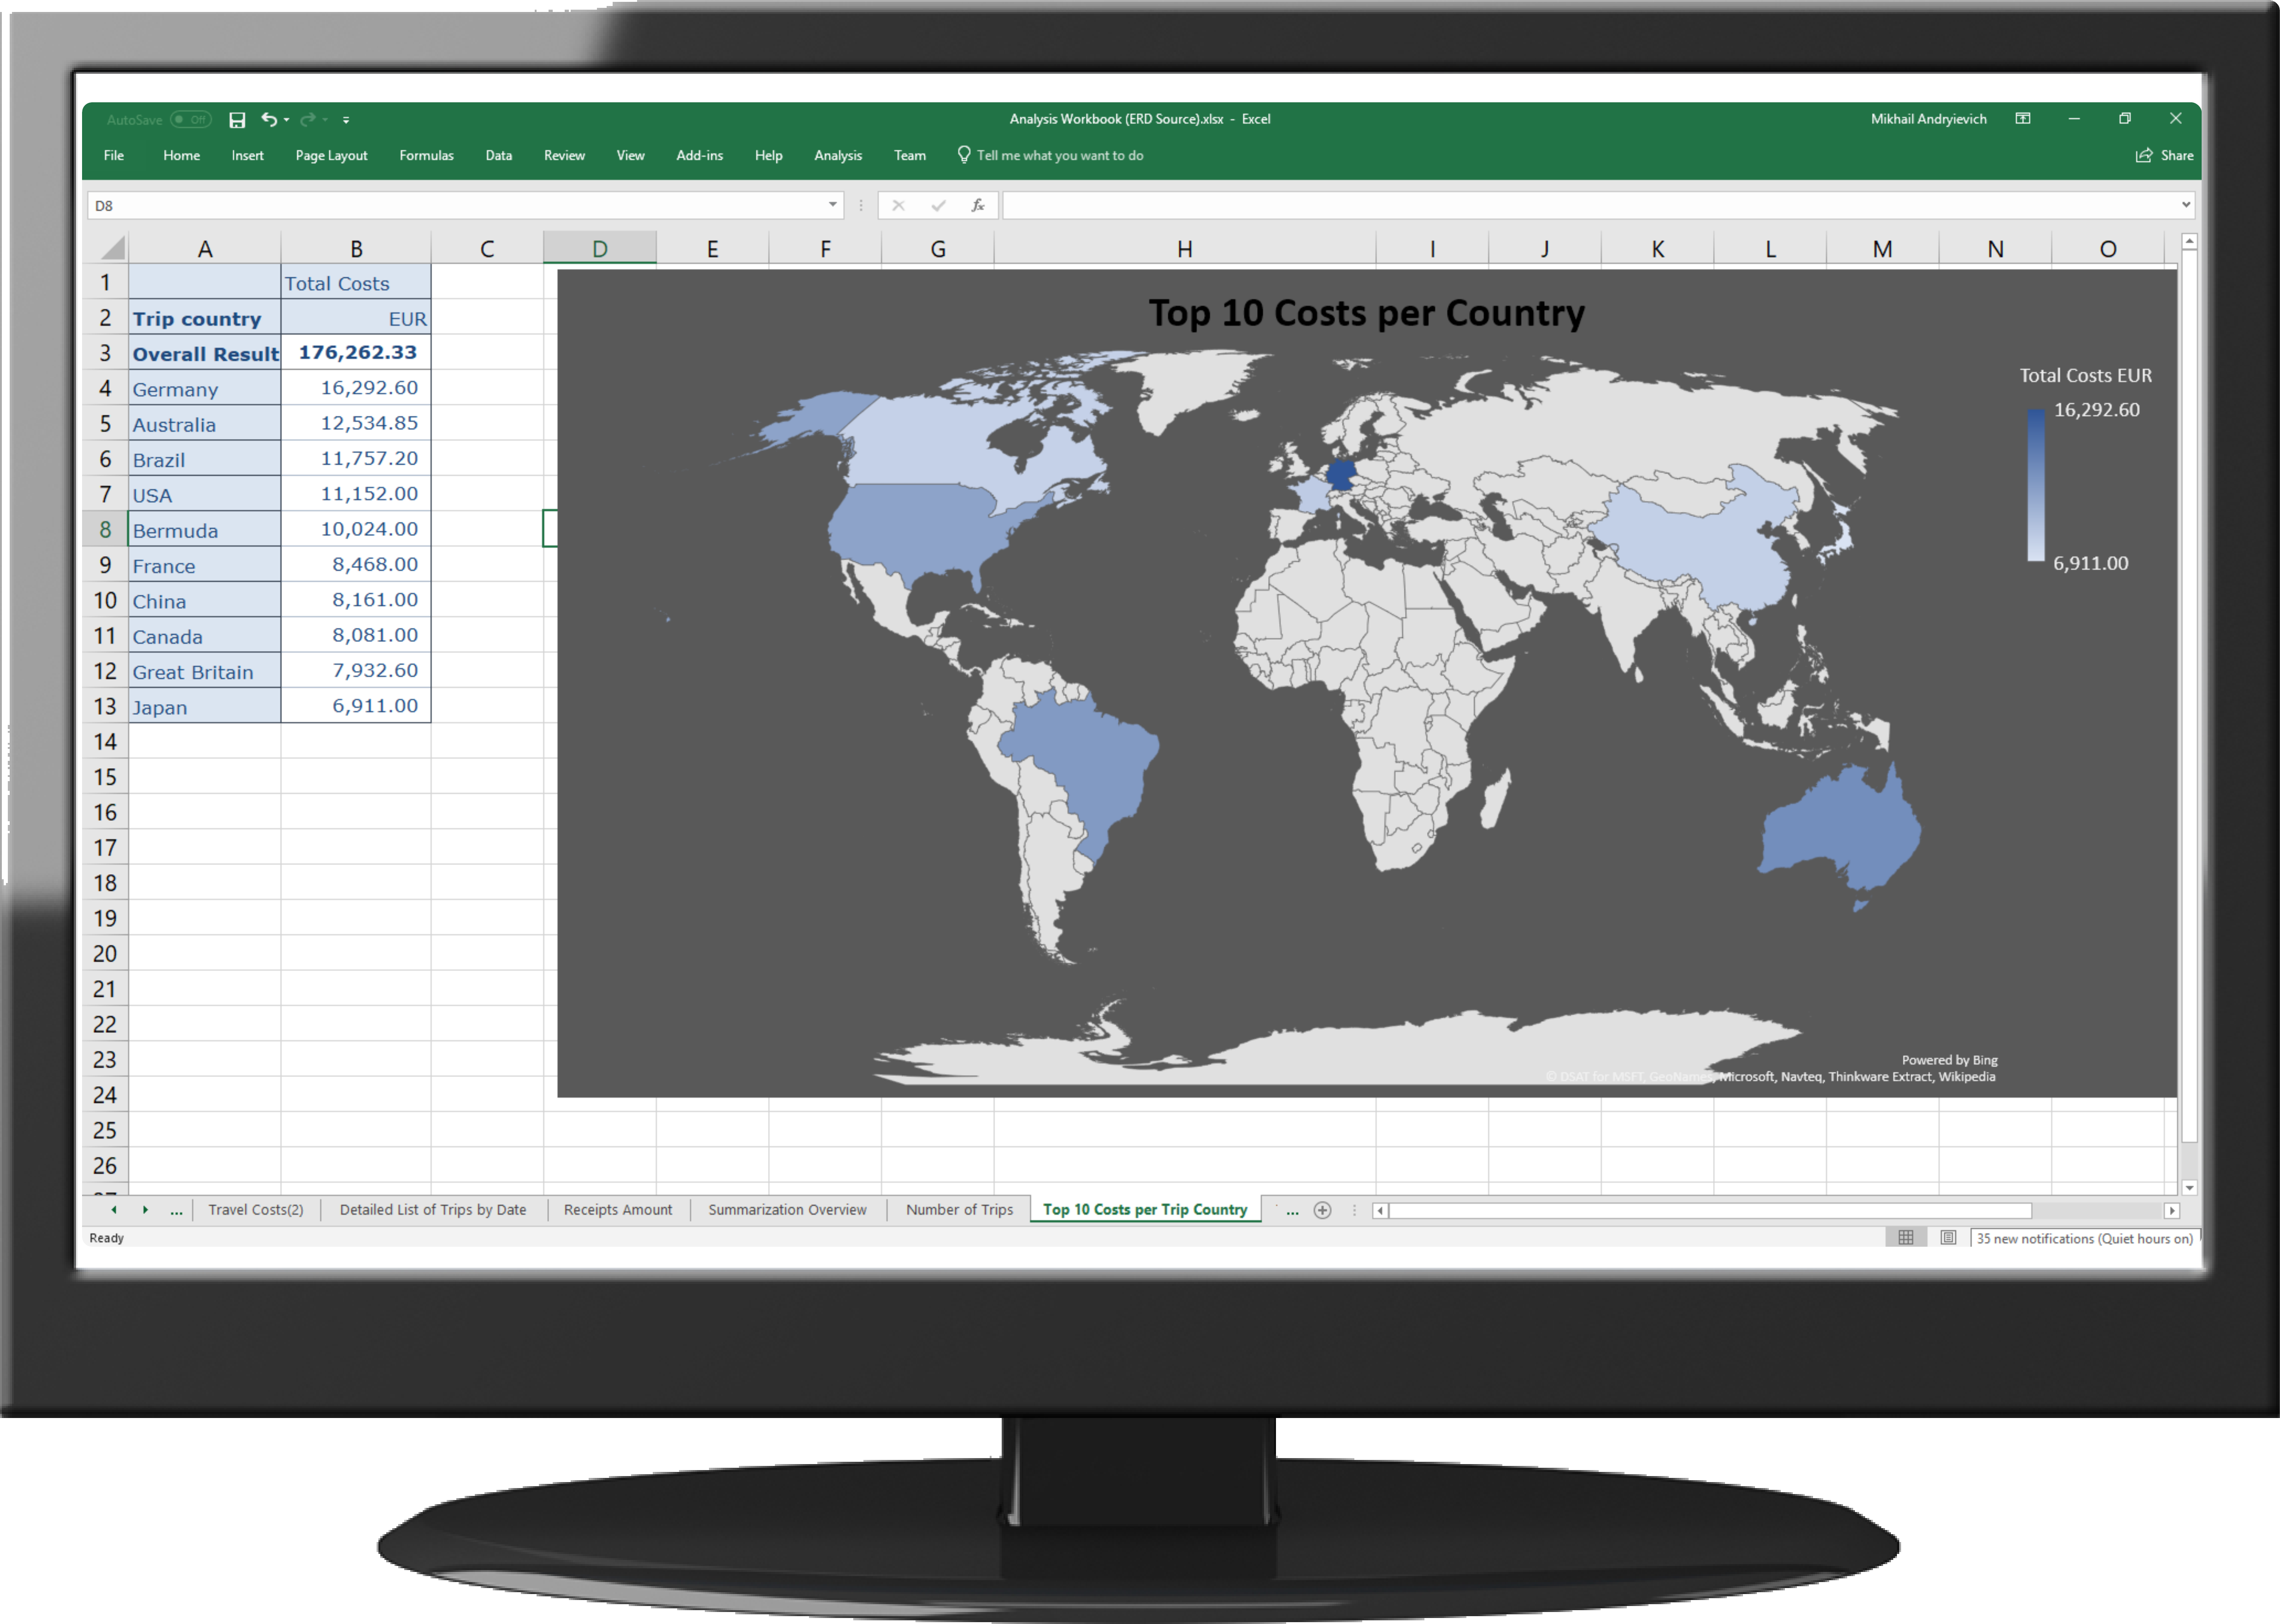
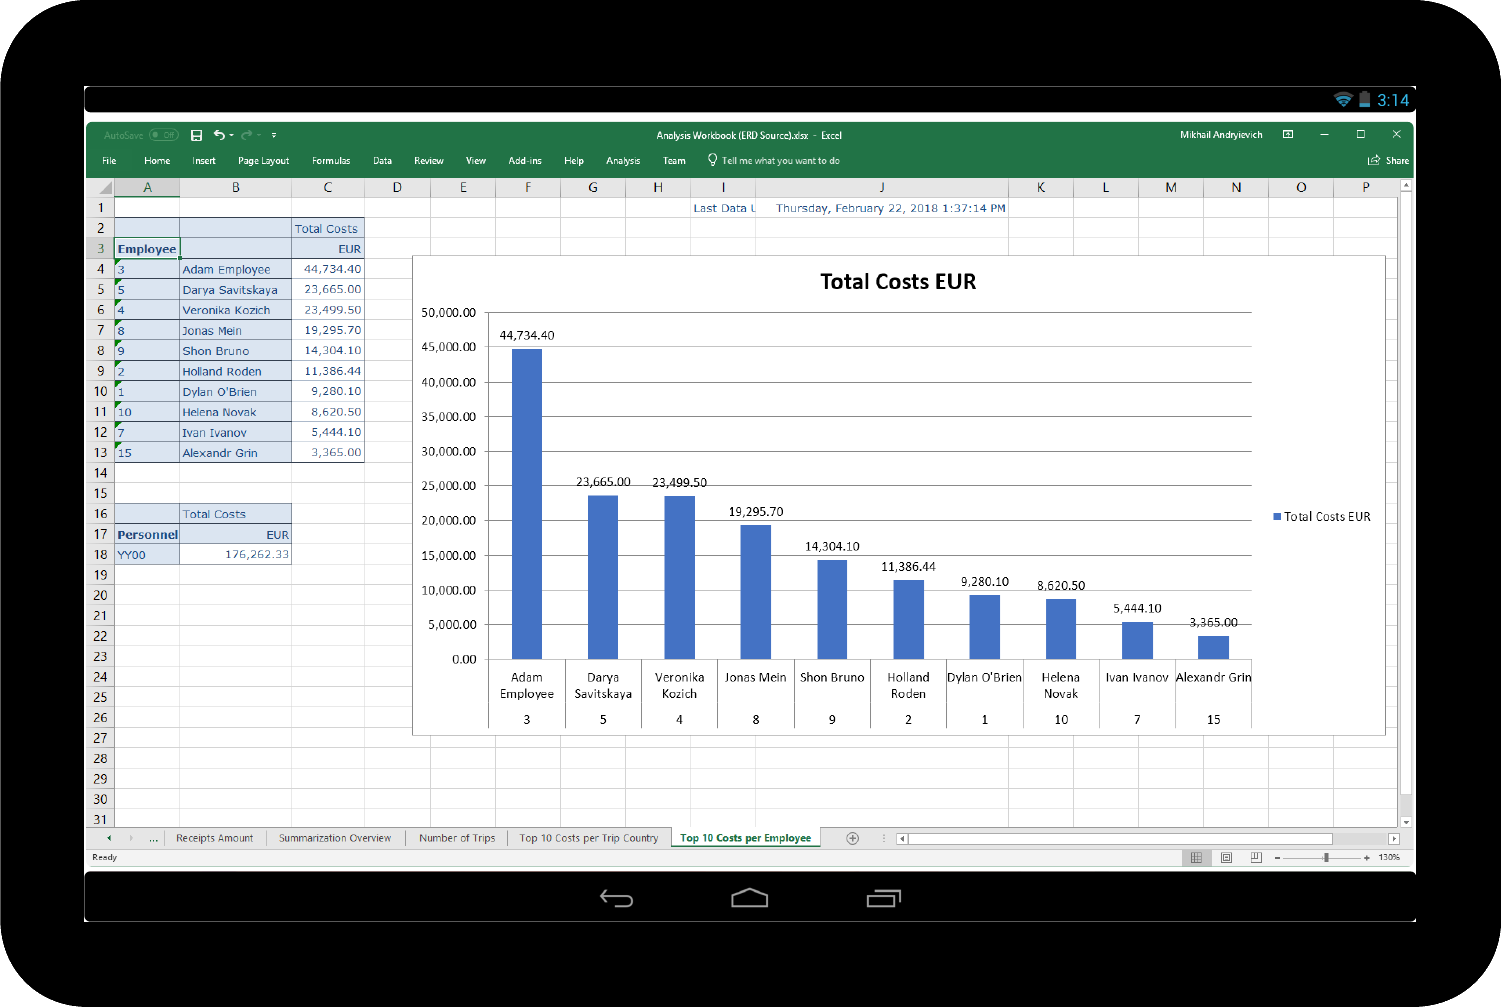
Analytics solution provides varied queries based on travel expenses data application in source systems.
The main goal of Travel Expenses data flow and Reporting development is to provide an opportunity to analyze business trips KPIs in SAP environment, for example, trip expenses per organizational unit, CO2 emission report per vehicle type, distances per trip, etc.
Conducting business in more sustainable ways is becoming increasingly relevant today and a “must-have” in the future. The sustainability megatrend is driven by a growing population, accelerating urbanization, resource intensity, government regulation, climate change, and – most importantly – by the fact that consumers are increasingly demanding healthy, affordable, as well as socially and environmentally responsible products. Organizations react by implementing more sustainable practices to grow their business, to attract the best talent and to remain relevant to their investors.
One of the main ways for the company to be sustainable is to control its travel expenses and its CO2 emission per travel.
Standard BI content (Data Source 0FI_TV_01, “Travel Expenses: Totals and Receipts” InfoCube) for Travel Expenses provides information only about trips, travelling employees, expenses per trip. But there is no information about trip distances: mileage covered by trip, emission. The information about vehicles used in a trip is not collected, either. So, it is impossible to calculate emission per trips, per employees, per organizational units.
For this purpose, the standard data source 0FI_TV_01 was enhanced, new info provider /SKYBFR/FITV was created based on standard 0FITV_C01 but with additional dimensions for specific reporting. The information about trip distances and emission is collected from source systems from travel expenses application.
Here are the key features of /SKYBFR/RTE2 1.2 Achernar BW on HANA Reporting:
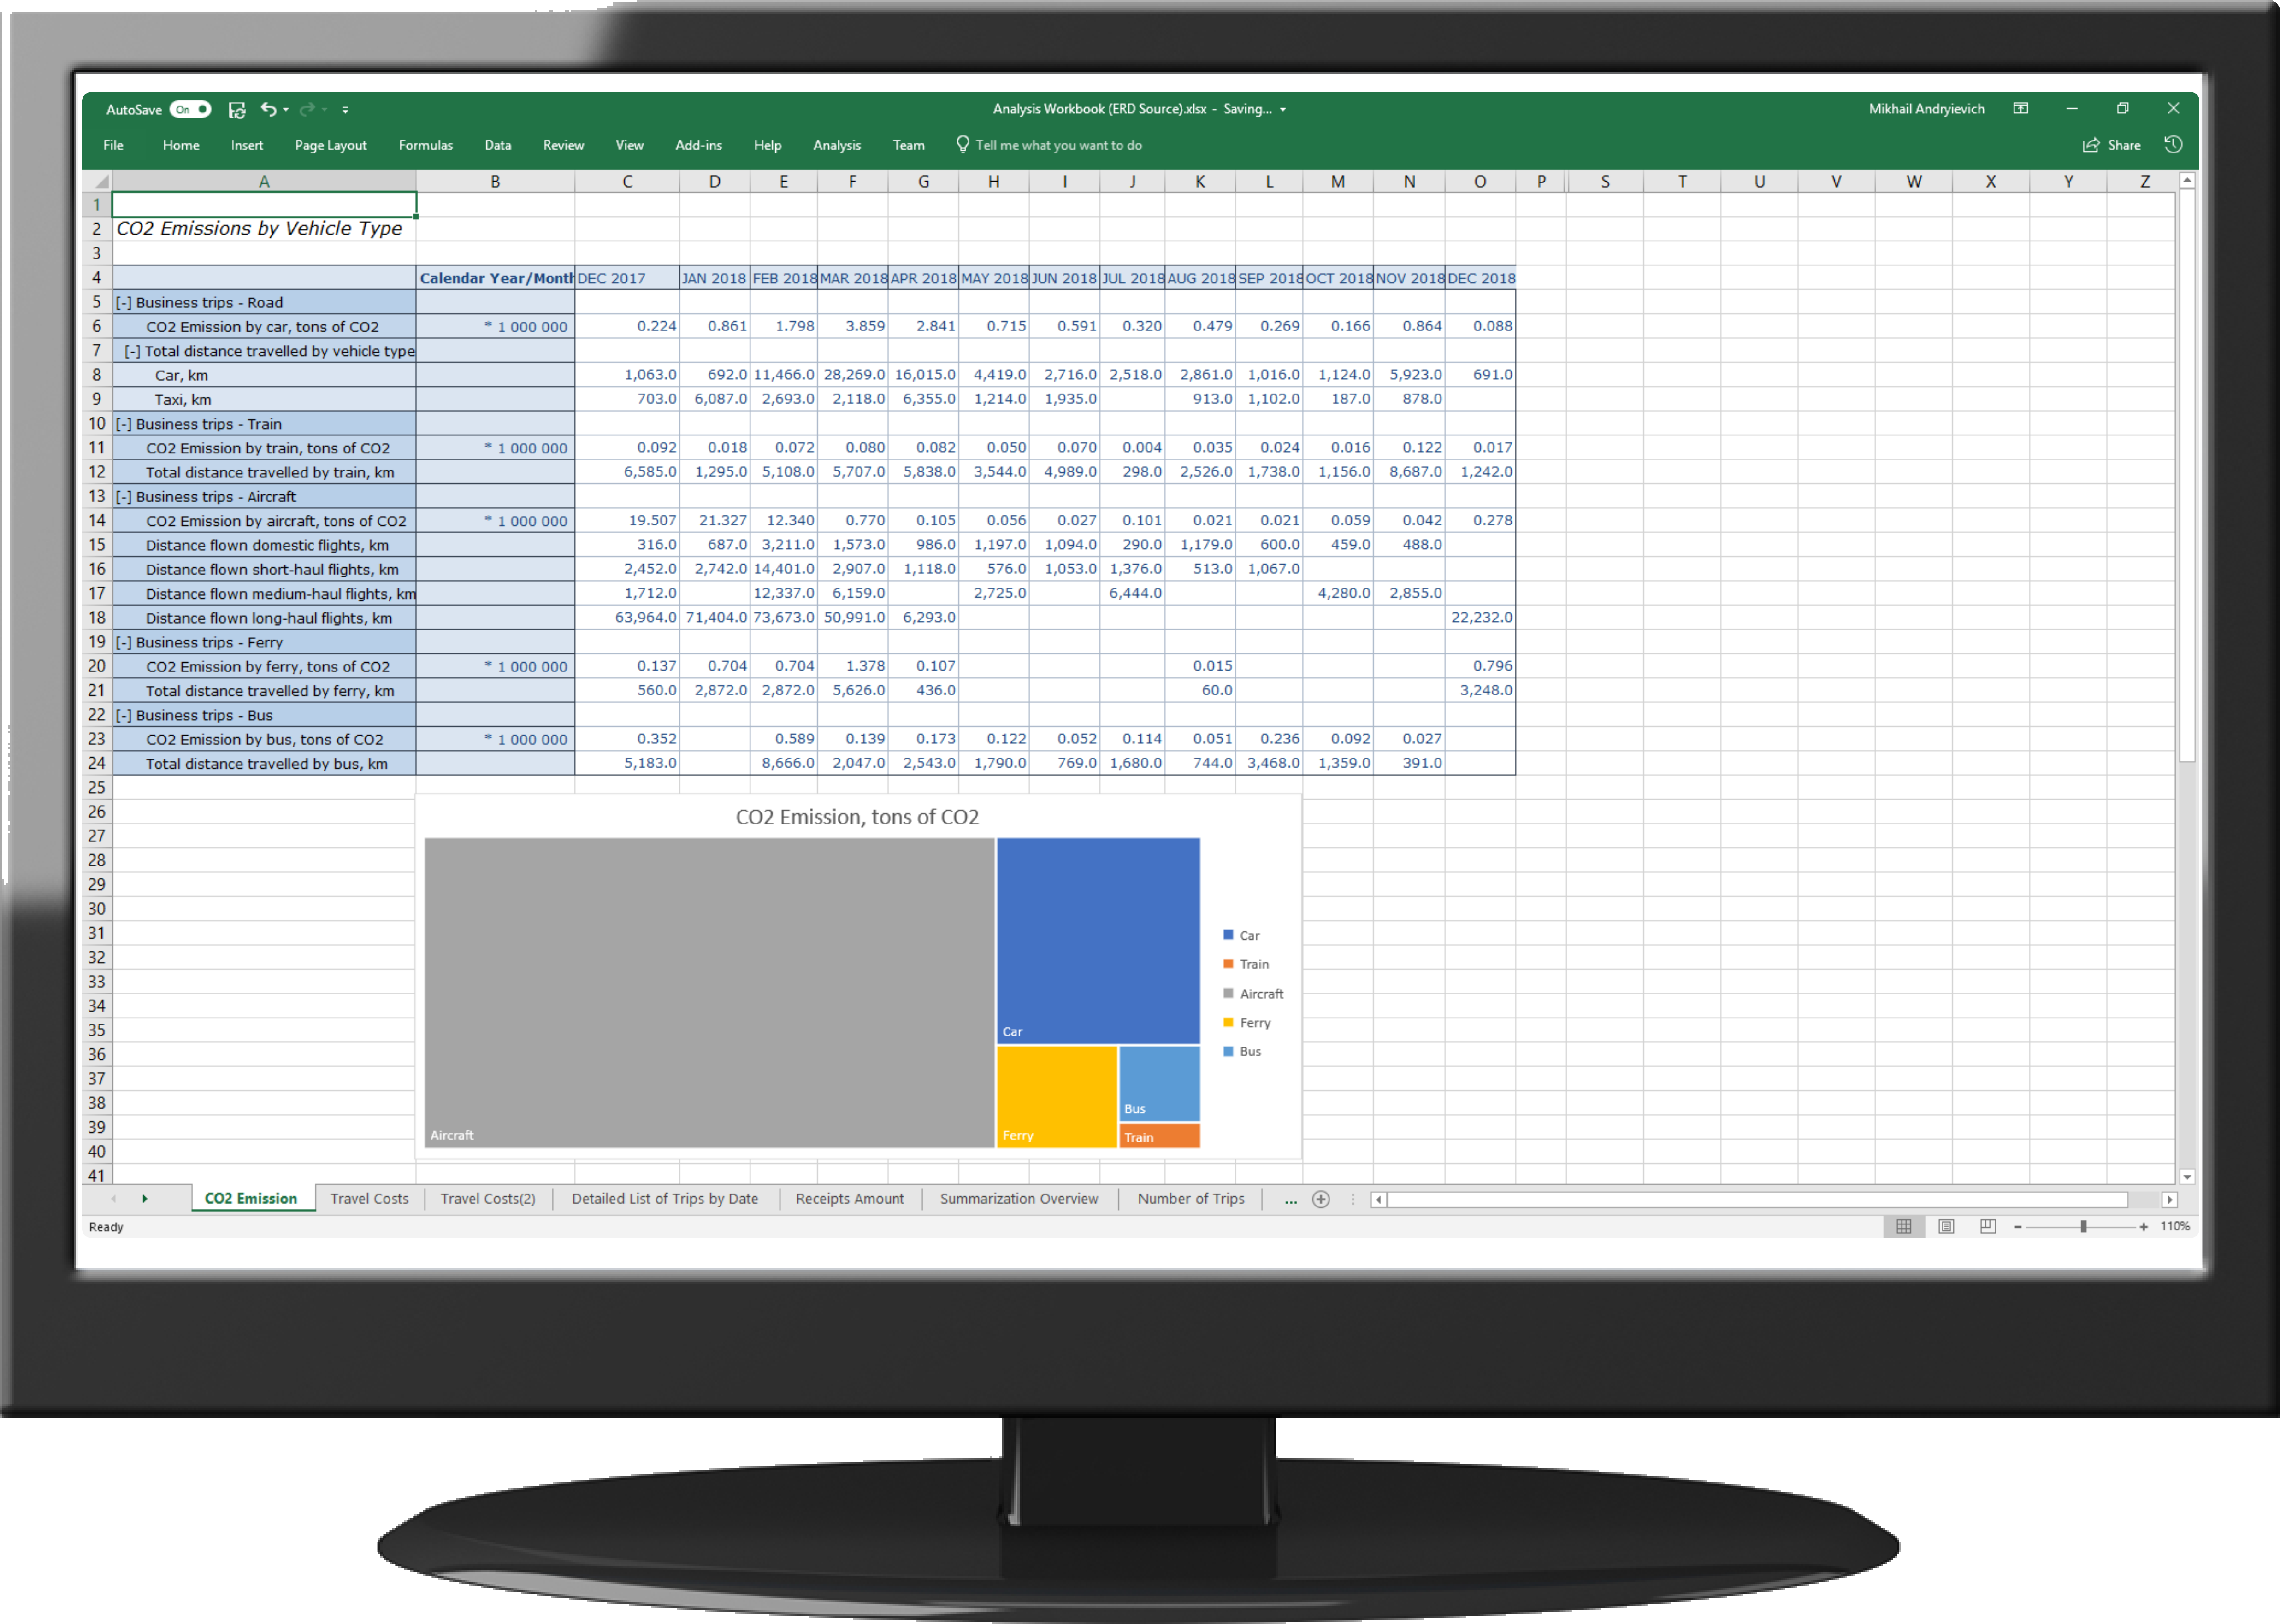
5383 :: BW Report: CO2 Emission by Vehicle Type
This report shows CO2 emission and distance in tons depending on different vehicle types (characteristic /SKYBFR/GRTYP (A, B, C, F, R, T..) original field /SKYBFR/GRTYP) per calendar month.
Average CO2 emission per different expense types can be found in table /SKYBFR/RTE1C_CO and customized through transaction /SKYBFR/RTE1_CO2.


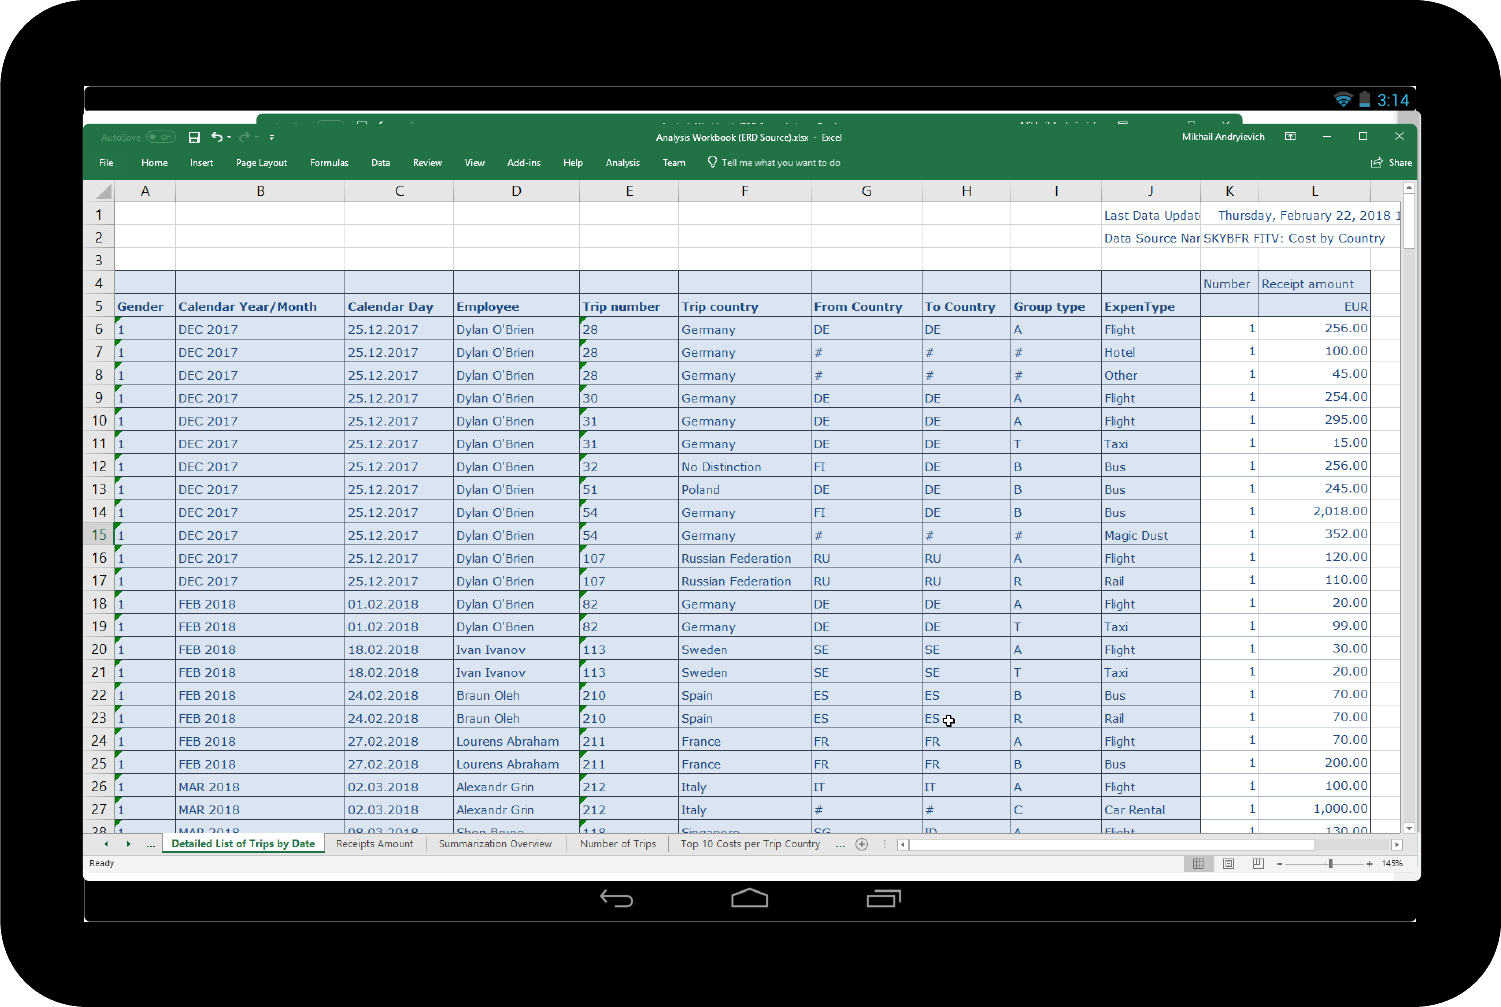
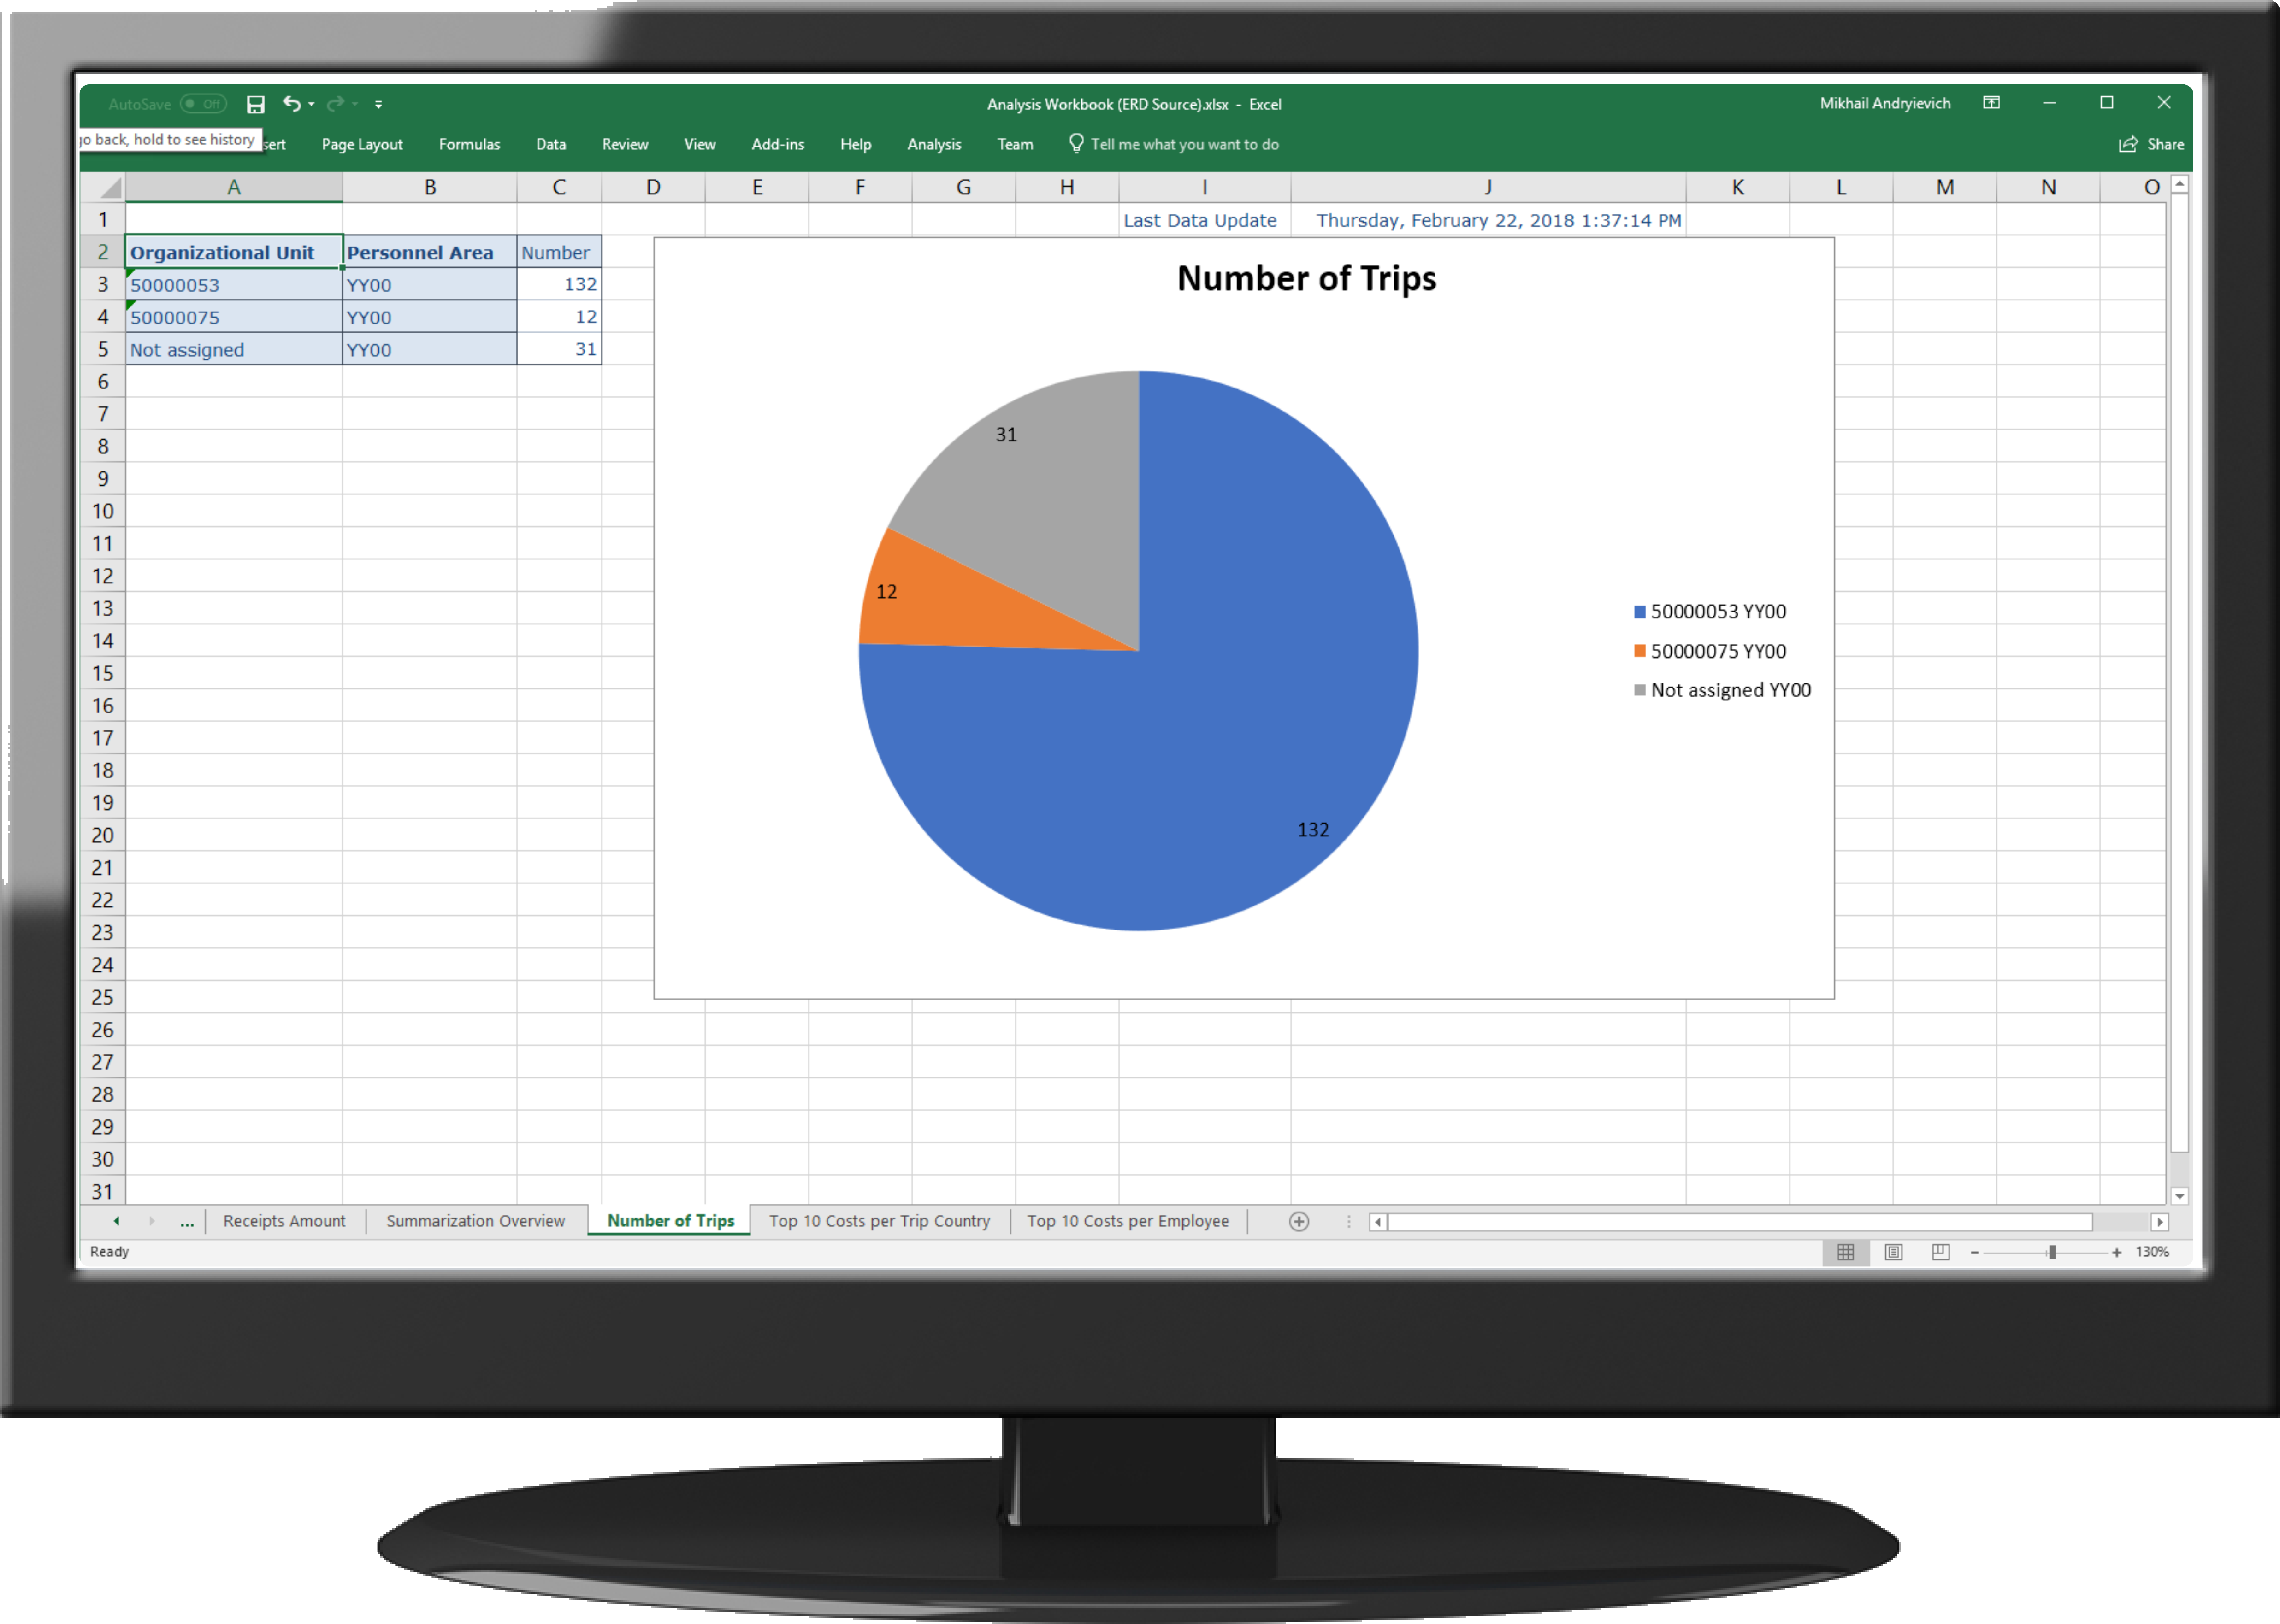
5386 :: BW Report: Detailed List of Trips by Date
This report shows detailed information per trips and employee that helps to monitor the number of trips and check details per each trip.


