It’s widely known what OLAP is and why it should be used. But let’s try to use the standard reporting tools which can be connected with Mondrian OLAP Server, for example. Looks a little bit outdated?! To be honest, it mostly looks like the end of 90th: minimalistic and poor. And of course, there is a way to improve the situation: we tried to use Saiku Analytics for accelerated reports development.
Meet Saiku Analytics
A part of Meteorite BI, Saiku is a lightweight open-source analytical tool which is written in HTML/JavaScript (jQuery) and focuses on fast and configurable OLAP analysis.
Saiku’s RESTful web server connects to existing OLAP systems via standard XML/A connectors. But compared to other reporting tools, what the main benefits Saiku has? First of all it is totally free. It uses only open standards and protocols. We can also say that Saiku is easy configurable (it takes no more than 10 minutes for a novice to install, configure and ran Saiku with the real data inside Mondrian’s OLAP cube). Also I can add that Saiku is used by a rapidly growing global community. But in my opinion the main advantage of using this tool for building the complete analytical system is its simplicity, flexibility and nice user interface.
But what if we don’t need Saiku User Interface? The second reason why we have tried to use this tool for our purposes is API. If you have ever worked with Mondrian you should know, that access to OLAP cubes available only via XML/A or Mondrian’s Java API and sometimes it seems that building a connector to OLAP especially if don’t want to move forward with Java is a complicated task. Saiku API allows to run MDX (Multidimensional Queries), overview statistics and perform reporting with the help of usualRESTful web services with JSON payload. I think that you should agree with me now: Saiku seems really promising!
Saiku: The First Impression
Let’s dive deeply into details instead of just describing the product superficially. Saiku uses Pentaho Mondrian, MDX queries andolap4j interface for communication with OLAP cube. Additionally Saiku can be used over any traditional relational database or can be a tool for analysing data retrieved via XML/A protocol from different multi-dimensional databases including Oracle Essbase, Microsoft Analysis Services and SAP BW.
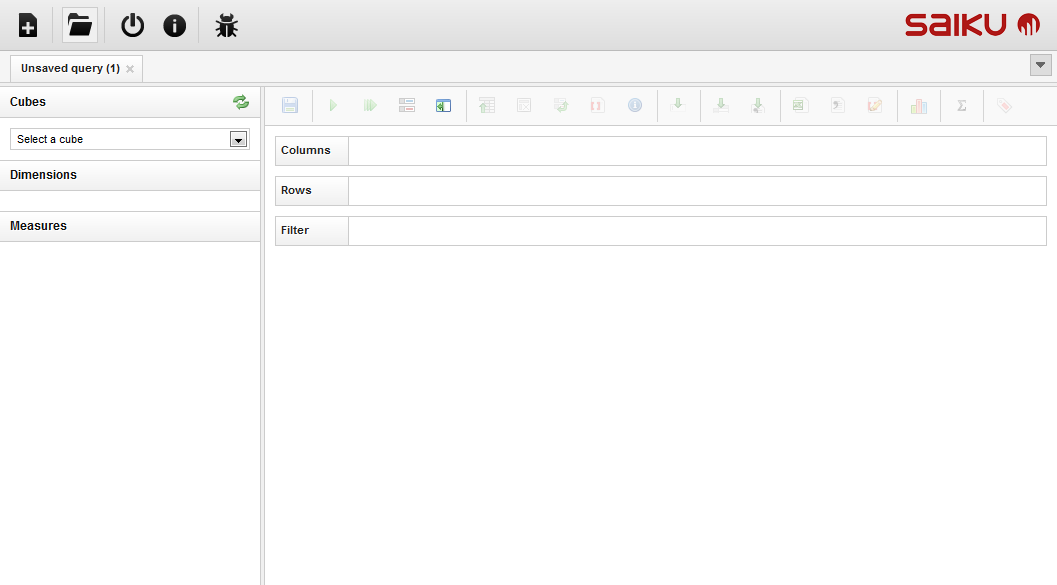
On the figure 1 we can see the main screen of application (the latest version of the application at the blogging time is 2.4):
At the very top it has several buttons: New Query, Open Query, Exit, About, Bug Tracker and Translation helper (if you want to submit your variant of translation).
Cubes view (left side of the screen) contains a select control which helps to select the specific OLAP cube. Dimensions area contains a hierarchy of dimensions for selected cube, measures could be selected from the measures area. All operations are very intuitive and easy in usage. Running MDX queries is not a complicated thing how it seems to be, the only thing you need here is to drag-and-drop measures/dimensions to the query area (right side of the screen) and MDX will be performed automatically. An example of simple multidimensional query in Saiku is shown on the figure 2:
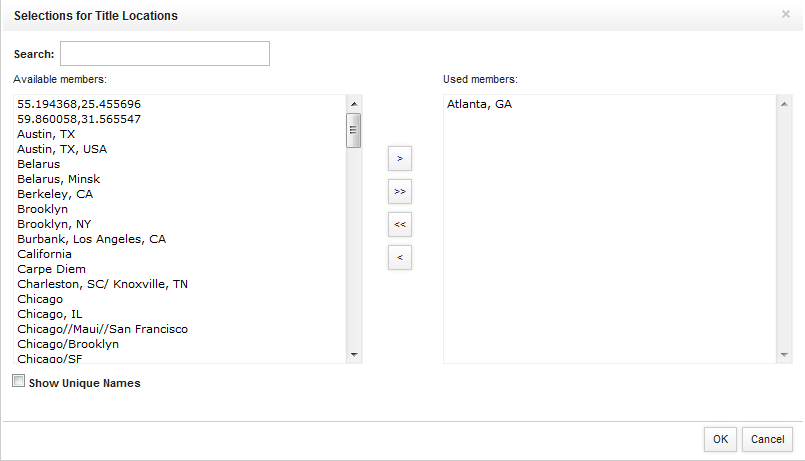
Here we can see the typical MDX query: on rows there is on measure “Users total”, on columns we have such dimensions as “Hashtag name” and “Screen name”. Everything is filtered by “Title Locations” dimension where location “Atlanta, GA” is chosen (see figure 3):
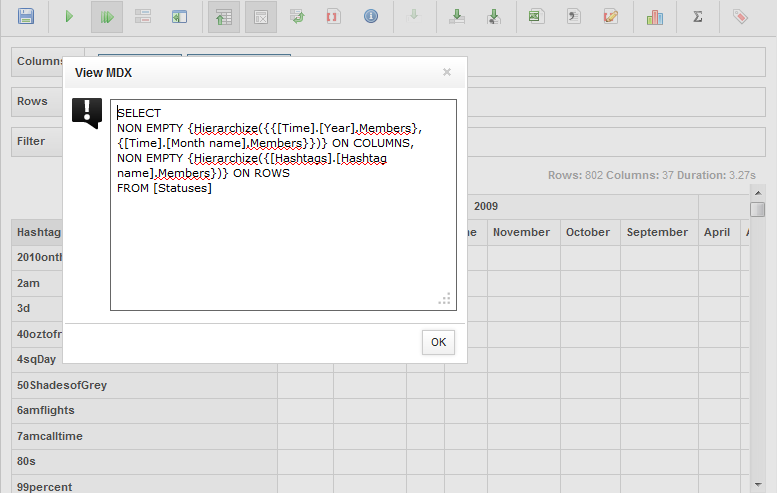
If needed we can easily overview MDX query in a separate window as it is shown on figure 4:
In addition the following main operations are available to improve the analysis possibilities in Saiku:
- Swap axes.
- Drill through on the specific cell.
- Export Drill-Through on cell to CSV file.
- Export to CSV/XLS.
- Switch to MDX mode (shows raw MDX instead of draggable measures/dimensions).
- Show chart view (shows chart based on current query data).
- Show basic statistics (shows aggregated statistics on the current query).
Distinguishing feature is that each query can be saved and used repeatedly. This becomes very helpful when you are working with the same analytical scenarios every day.
With all of this features it is very easy to perform a basic analysis of the data stored in cube. According Saiku’s product development roadmap in its future releases this tool will have more analytical features including detailed charts, which seems to be very important for OLAP based analysis.
Saiku: Application Programming Interface (API)
But what if you are looking for the easiest way to work with existing OLAP cubes without Saiku UI utilization to perform your analytical tasks? Here is one possible workaround: Saiku can be used as an RESTful web-services provider with JSON data payload.
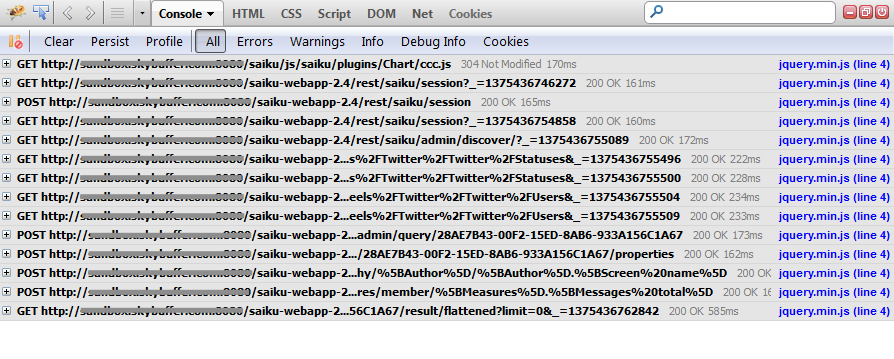
The clearest way how to work with Saiku API is to open Saiku UI in Mozilla Firefox with installed Firebug add-on. In Firebug’s console it will be easy to overview the web-services which are triggered when we navigate through the cubes and queries (figure 5):
Login is only one operation which is required before you will start to use Saiku. For this operation you need to start with jquery by simply doing a POST to:
http://[your saiku domain]/saiku/rest/saiku/session with the following POST parameters : username, password (e.g.: username=admin&password=admin).
After that you can make any call you want with jQuery. Important notice here is that jQuery code has to be on the same domain as the Saiku backend (or you can use the node server.js in the UI folder as proxy or any other proxy) otherwise there will be a cross domain problem in your browser.
After performing login to the system we are able to run existing queries or even evaluate MDX queries within our own UI written in JavaScript/jQuery. Sounds awesome, isn’t it?
The High-Level BI Solution Architecture
By combining different tools together it is very easy to implement flexible and powerful analytical system. On figure 6 it is shown one of the examples of analytical system which can be built around Pentaho Mondrian and Saiku applications. In addition to usual Saiku UI it has a separate back-end part written in Python which includes the logic for communicating with OLAP cube via Saiku APIs. The main purpose of this Python middleware is to provide an opportunity to work with multidimensional databases via predefined scenarios, provide reports and necessary OLAP analytics.
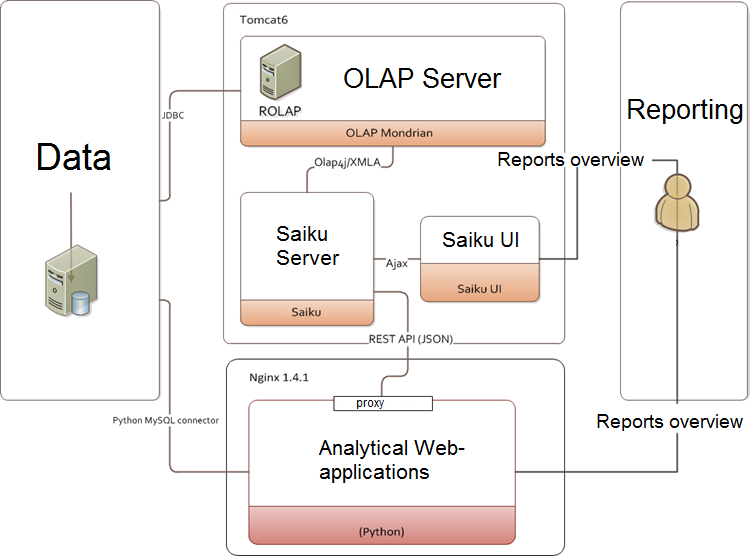
The analytical possibilities seems to be clear here: user can overview data stored in OLAP with the help of Saiku UI or user can get necessary reports via predefined queries and scenarios (for this part the separate UI with a Python backend can be used. In this case access to the data is managed by Saiku API). In my personal opinion Saiku API is one of the best lightweight tools for communicating with OLAP cubes.
Conclusion
Saiku by Analytical Labs is good and actively developing tool for OLAP analysis needs. It is also available in Enterprise Edition (EE) which comes with a number of extensions for customers wishing Saiku in theirs commercial environment. No matter what approach you will chose: to use Saiku as a OLAP API provider or as a separate tool for multidimensional analysis – it’s a nice application for web reporting based on OLAP technology.
